The SRE Orchestrator
The problem
Section titled “The problem”Most production incidents are re-runs of an earlier one, and most of the first twenty minutes goes on the same four commands: read the container’s output, look at its resource use, check what changed, check whether it is only this one. That work is mechanical, it happens at the worst possible hour, and doing it by hand is why the useful part starts late.
What it is
Section titled “What it is”A separate service that watches for trouble, gathers the evidence a person would have gathered, asks a model to read it, and turns the answer into an incident with a proposed remedy attached. What it does not do by default is carry the remedy out.
Three things can start an incident:
- an alert from the monitoring stack;
- a change the service sees on the platform’s own event keys — a deployment that failed, a health check that failed, an application error;
- somebody asking for one, from the console or through the assistant’s incident tool.
Repeat alerts collapse into one incident. Two alerts are the same incident when their name, their container and their stable labels agree inside a time window, so a container restarting in a loop produces one thing to look at rather than forty.
What happens to an incident
Section titled “What happens to an incident”It is attributed to a tenant first. The label is used if it names one; otherwise the node it came from is resolved to the tenant that owns that node; otherwise it belongs to the platform. Attribution happens before anything else, because everything after it is stored and read inside one tenant’s scope.
Evidence is gathered: the container’s recent output, its resource use, its configuration, recent events around it, the metrics for restarts and saturation, and any traces.
A model reads the evidence and answers in a fixed shape: how risky this is, what kind of resolution it is, the commands it proposes, and whether a person is required. The proposal is never free text the service acts on — it is a structured answer with a risk level per command.
The guardrails then judge each command, and this is where the automation stops or continues.
A person approves, or nothing runs. An incident whose commands were blocked waits for approval. Approving it re-runs those commands, and they pass through the same blocklist checks again — approval bypasses the rollout phase, not the dangerous-command list.
What is allowed to run without a person
Section titled “What is allowed to run without a person”By default, nothing. The service ships in the first of four rollout phases, and that phase allows no automatic remedy at any risk level; the later phases add low, then medium, then high risk. On top of the phase there are seven more checks: a blocked-container list, a blocked-alert list (a database being down and a data-loss alert are both on it out of the box), a dangerous-pattern list matched against the command text, a severity gate, a risk gate, a limit of three commands per incident per hour, and a cool-down between remedies for the same fingerprint.
Two things about this are worth saying plainly rather than leaving to be discovered.
Diagnostic commands are not phase-gated. When the analysis concludes that nothing is wrong or that the cause is external, the diagnostic commands it proposed are run to confirm that, in every phase including the first. They are still subject to the dangerous-pattern list.
A command is a shell command. There is no allow-list of programs and no sandbox: what stands between a proposed command and the machine is the pattern list and the phase. That is a deliberate design point rather than an oversight — the value of the service is that it can run what an engineer would have run — but it is the reason the rollout phase exists and the reason the default is to run nothing.
Which phase is actually configured is not visible from the source. It is operator-set state, edited from the console and stored in the platform’s key-value store, and the service refuses to start if it is missing. To know what a given deployment will do automatically, read its configuration, not this page.
One service, many tenants
Section titled “One service, many tenants”There is one process for the whole platform, not one per tenant. Isolation is in the data: every incident is stored under its tenant, every read and write is scoped to one, and the control plane strips any tenant identity a caller supplies before proxying and injects the one it verified. A platform operator with no tenant selected gets an all-tenant view, and that widening is recorded to a separate audit log rather than being silent.
The automation policy itself is platform-wide. The guardrails, the rollout phase and the notification settings live at one key and are changed by a platform operator; every tenant runs under the same policy. A per-tenant policy does not exist.
Who can do what
Section titled “Who can do what”Reading incidents needs one permission, approving or dismissing one needs another, raising one needs a third, and changing the configuration needs a fourth and platform-operator standing on top of it. The full list, with the roles that hold each permission, is the roles reference.
Not this
This page does not tell you how to run the service or what to set its rollout phase to; that is an operational decision with a per-deployment answer.
Two things are deliberately not asserted here because the source cannot settle them. Live console updates are pushed from the service to a control-plane address that is registered behind authentication and a permission, while the service’s own client sends no credential and treats a failure as a logged warning — whether that push succeeds in a given deployment is a question for that deployment, not for this page. And incidents are stored in the platform’s key-value store under a retention sweep measured in days; they have been the largest single consumer of that store, and no offload of them exists yet.
Walking through an incident on the dashboard
Section titled “Walking through an incident on the dashboard”Open SRE Automation in the sidebar (Operations section). An open incident shows its
severity, the tenant it belongs to, and the safety guardrails that constrain what it is allowed
to do automatically — see sre-orchestrator/app/safety_guardrails.py. Approving a remediation
needs the sre:approve permission; changing what the orchestrator is allowed to do unattended
needs sre:configure. See the task guide for approving one.
Where to see it
Section titled “Where to see it”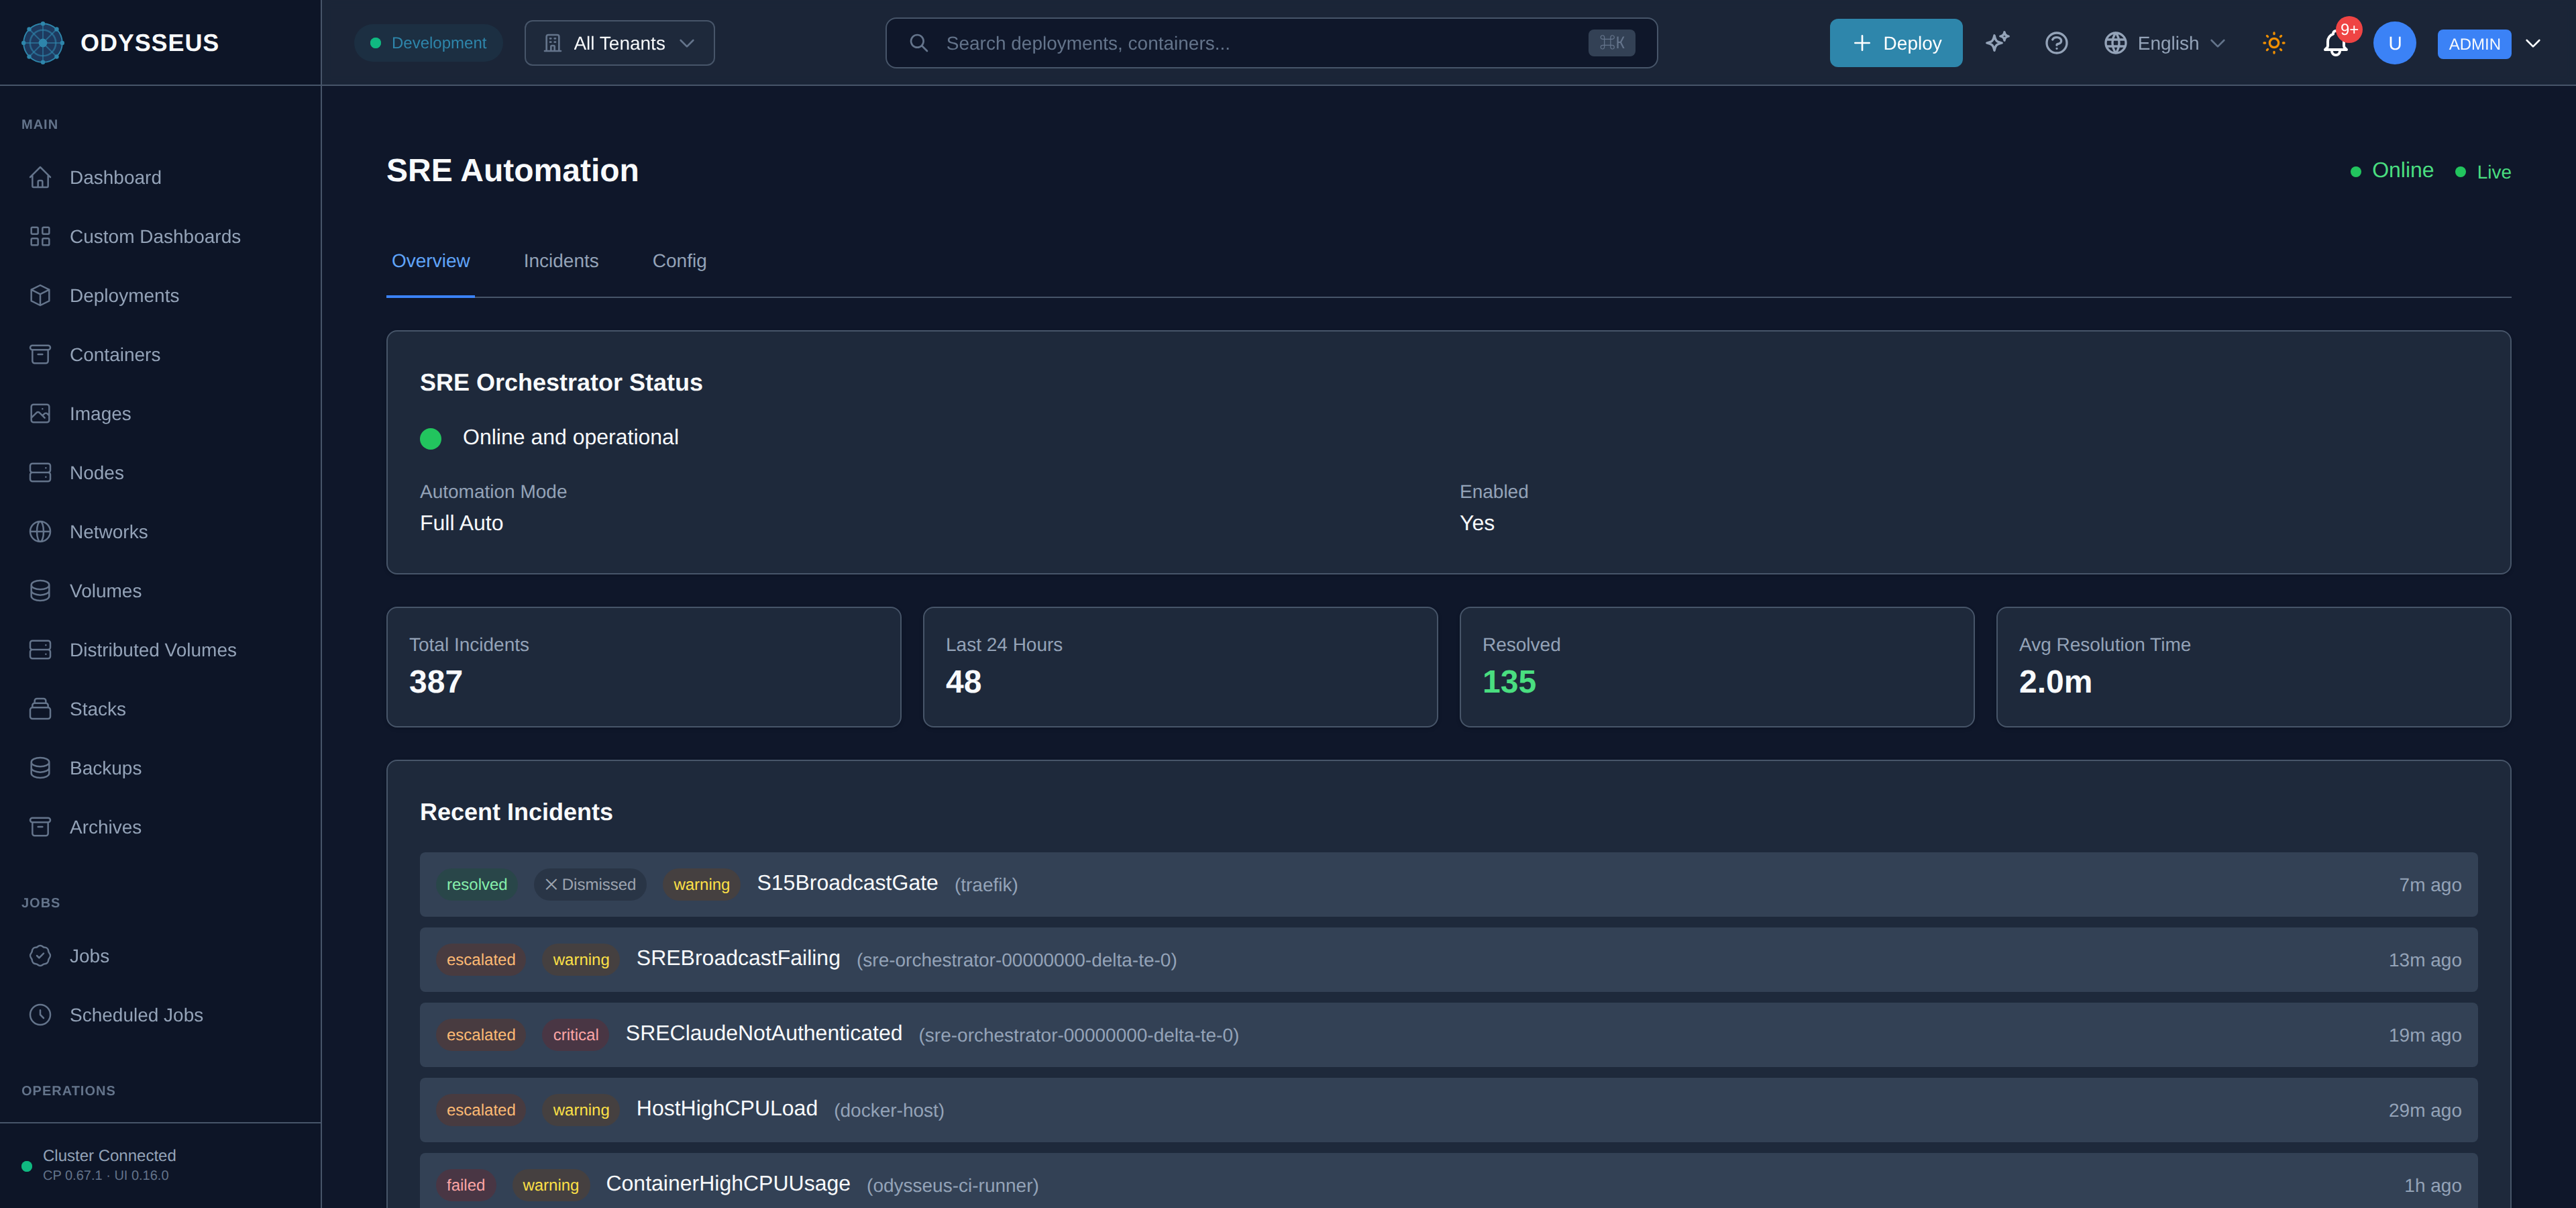
- Every permission and the roles that hold it: roles reference.
- Why a container restarting in a loop is an incident at all: health and reaping.