User Guide
This guide covers everything you need to manage your infrastructure with Odysseus. The platform is fully managed -- the control plane runs on Delta Telematics infrastructure. You interact with it through the dashboard.
Accessing Odysseus
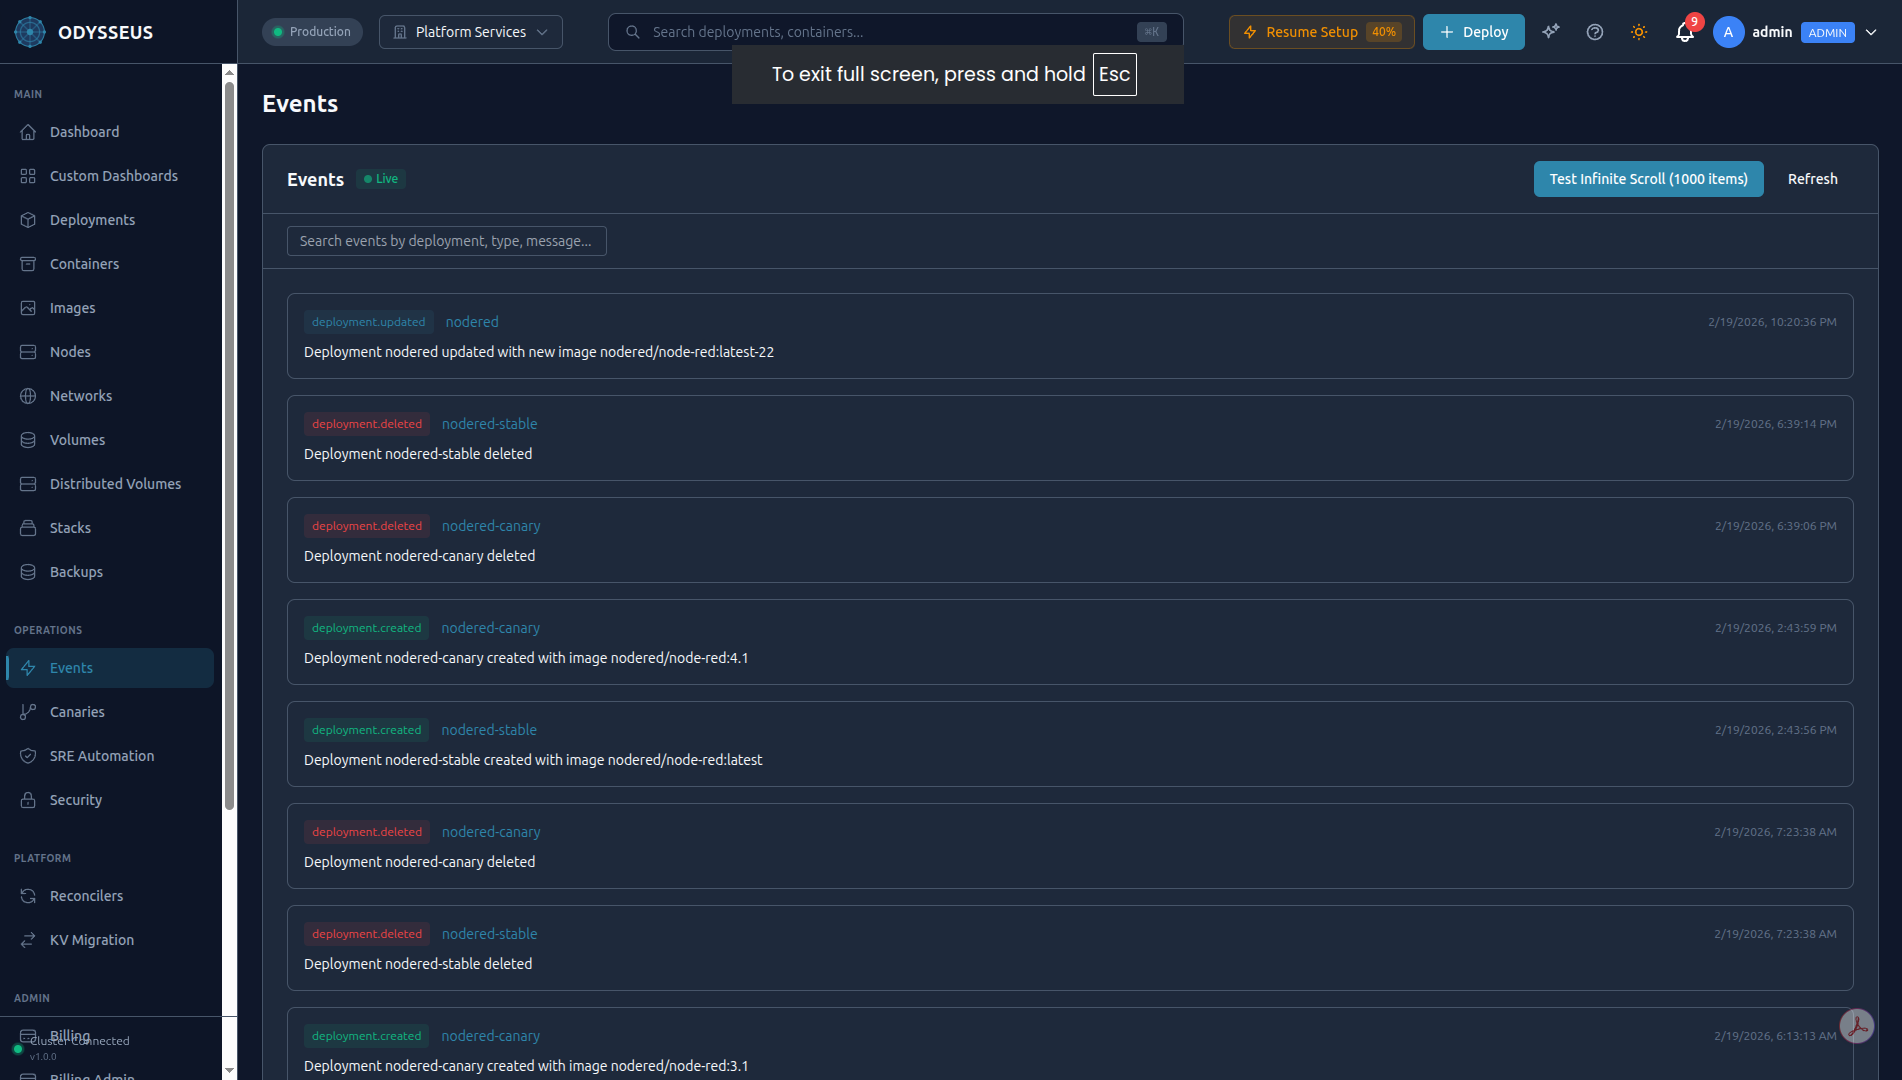
The dashboard is available at odysseus.delta-telematics.dev in any modern browser. It provides visual management of nodes, deployments, containers, logs, incidents, CVE scan results, and the Athena AI chat panel. No installation required -- just sign in.
Managing Nodes
Nodes are the servers where your containers run. The Odysseus agent runs on each node and communicates with the hosted control plane over an encrypted WireGuard VPN tunnel.
Enrolling a Node
From the dashboard, navigate to Nodes > Add Node to get a fresh install command with an enrollment token. Run it on the target server:
curl -fsSL https://odysseus.delta-telematics.dev/install | sudo bash -s -- --token YOUR_ENROLLMENT_TOKENThe agent installs as a systemd service, establishes the VPN tunnel, and registers with the control plane. The node appears in the dashboard within seconds.
Node Health Monitoring
The dashboard displays real-time health for every node:
- Status indicator: Green (healthy), yellow (degraded), red (unreachable).
- Resource usage: CPU, memory, and disk utilization with historical graphs.
- Container count: Number of running containers and their aggregate resource consumption.
- Agent version: Current agent version with upgrade status.
Multi-Node Clusters
Enroll multiple nodes to form a cluster. Odysseus schedules containers across nodes based on available resources and placement constraints. All inter-node communication uses the encrypted WireGuard VPN mesh -- no additional network configuration required.
Agent Auto-Upgrades
The agent upgrades itself automatically when a new version is available. The upgrade process is zero-downtime: the new version starts, verifies health, and takes over. If the new version fails health checks, the agent rolls back to the previous version automatically. No manual intervention required.
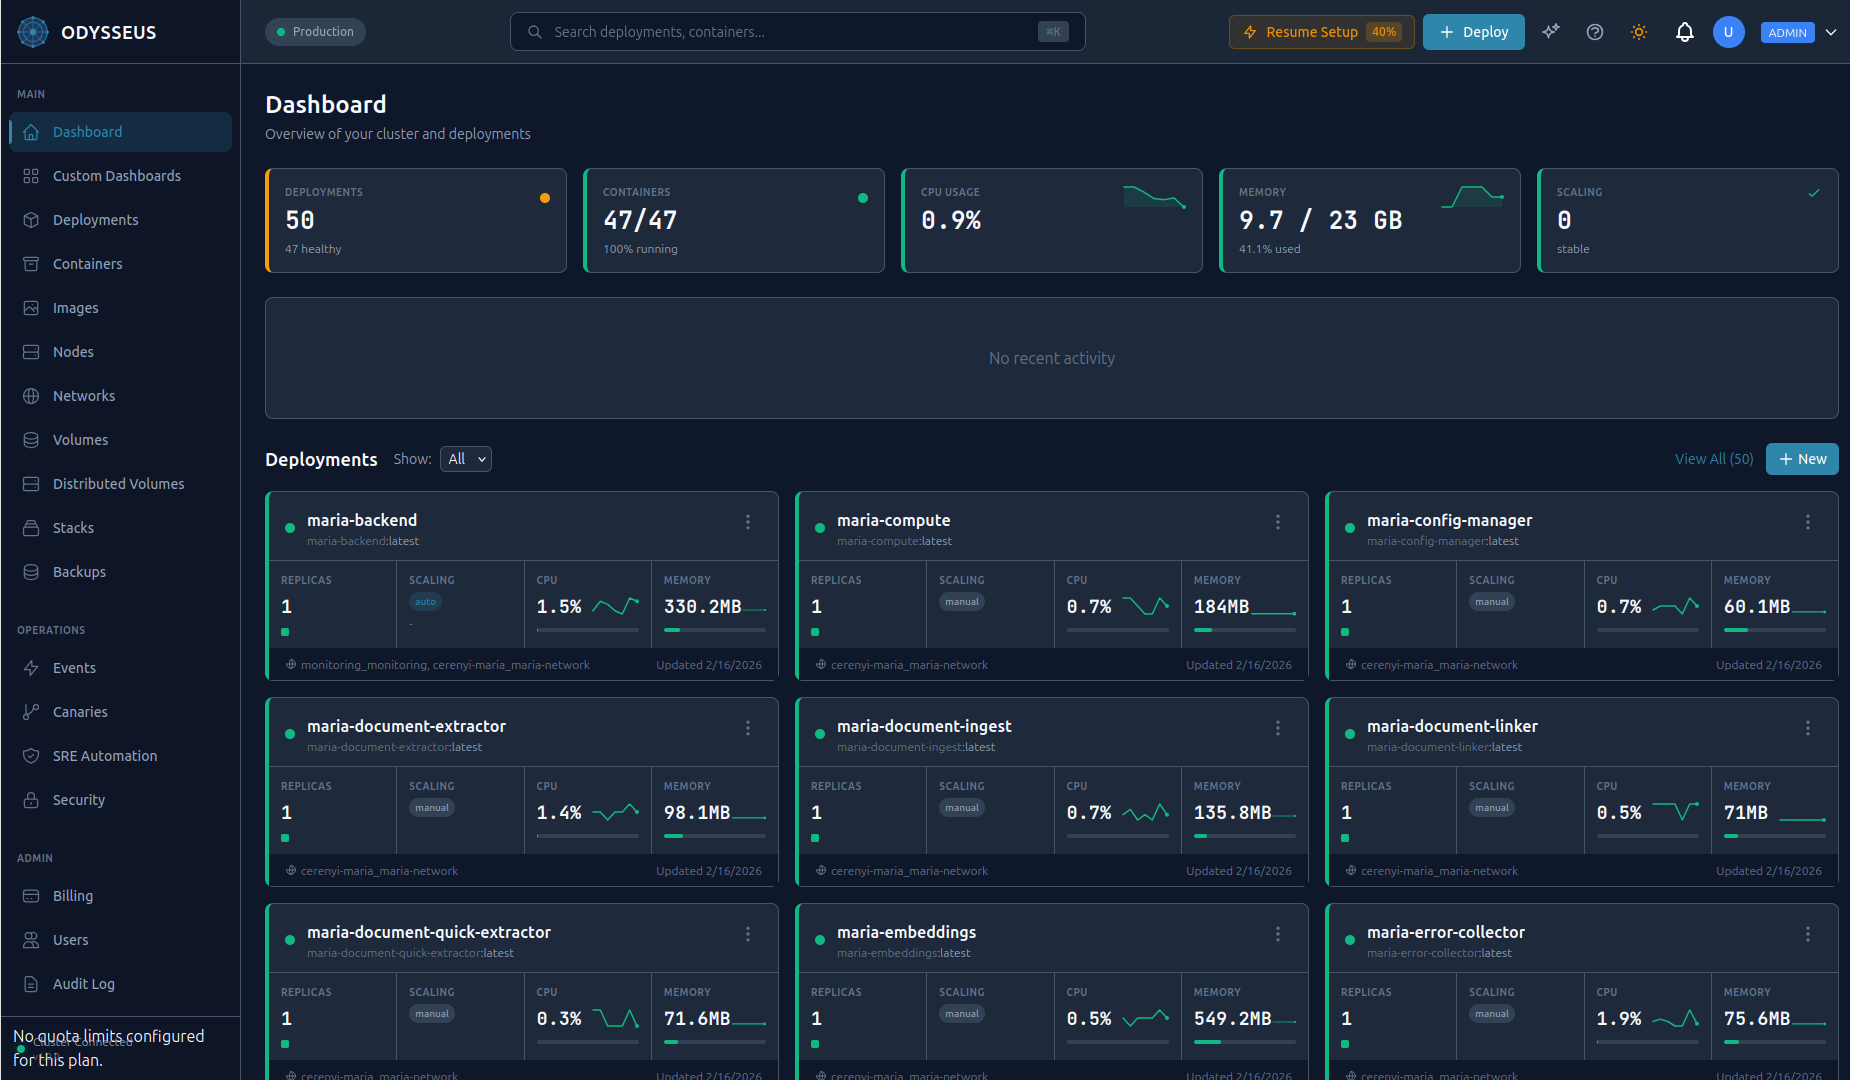
Deployments
A deployment defines a containerized application: its image, replica count, resource limits, ports, environment variables, and health checks. Odysseus manages the full lifecycle from creation through scaling and updates.
Creating a Deployment
Click New Deployment in the dashboard and fill in the form -- name, image, replicas, ports, environment variables, and resource limits. Click Deploy.
Deployment Lifecycle
When you create or update a deployment, it moves through these states:
- Scheduling -- The control plane selects nodes based on available resources and placement rules.
- Starting -- The agent on each selected node pulls the image and starts containers.
- Running -- Containers are healthy and serving traffic. Health checks are monitored continuously.
If a container fails a health check or crashes, Odysseus automatically restarts it. If a node goes offline, containers are rescheduled to healthy nodes.
Updating a Deployment
Change the image version, resource limits, environment variables, or any other configuration from the deployment settings page. Odysseus performs a rolling update by default -- new containers start before old ones stop, maintaining availability throughout.
Rollback
Every update creates a new revision. Roll back to any previous revision instantly from the deployment's revision history in the dashboard.
Rollbacks are instant -- Odysseus redeploys the containers from the selected revision's configuration. No image rebuild required.
Deployment History
The dashboard shows a complete revision timeline for every deployment: who changed what, when, and the resulting container state. Filter by date range, author, or change type.
Autoscaling
Autoscaling adjusts the number of replicas for a deployment based on real-time resource metrics. Prometheus metrics drive the scaling decisions.
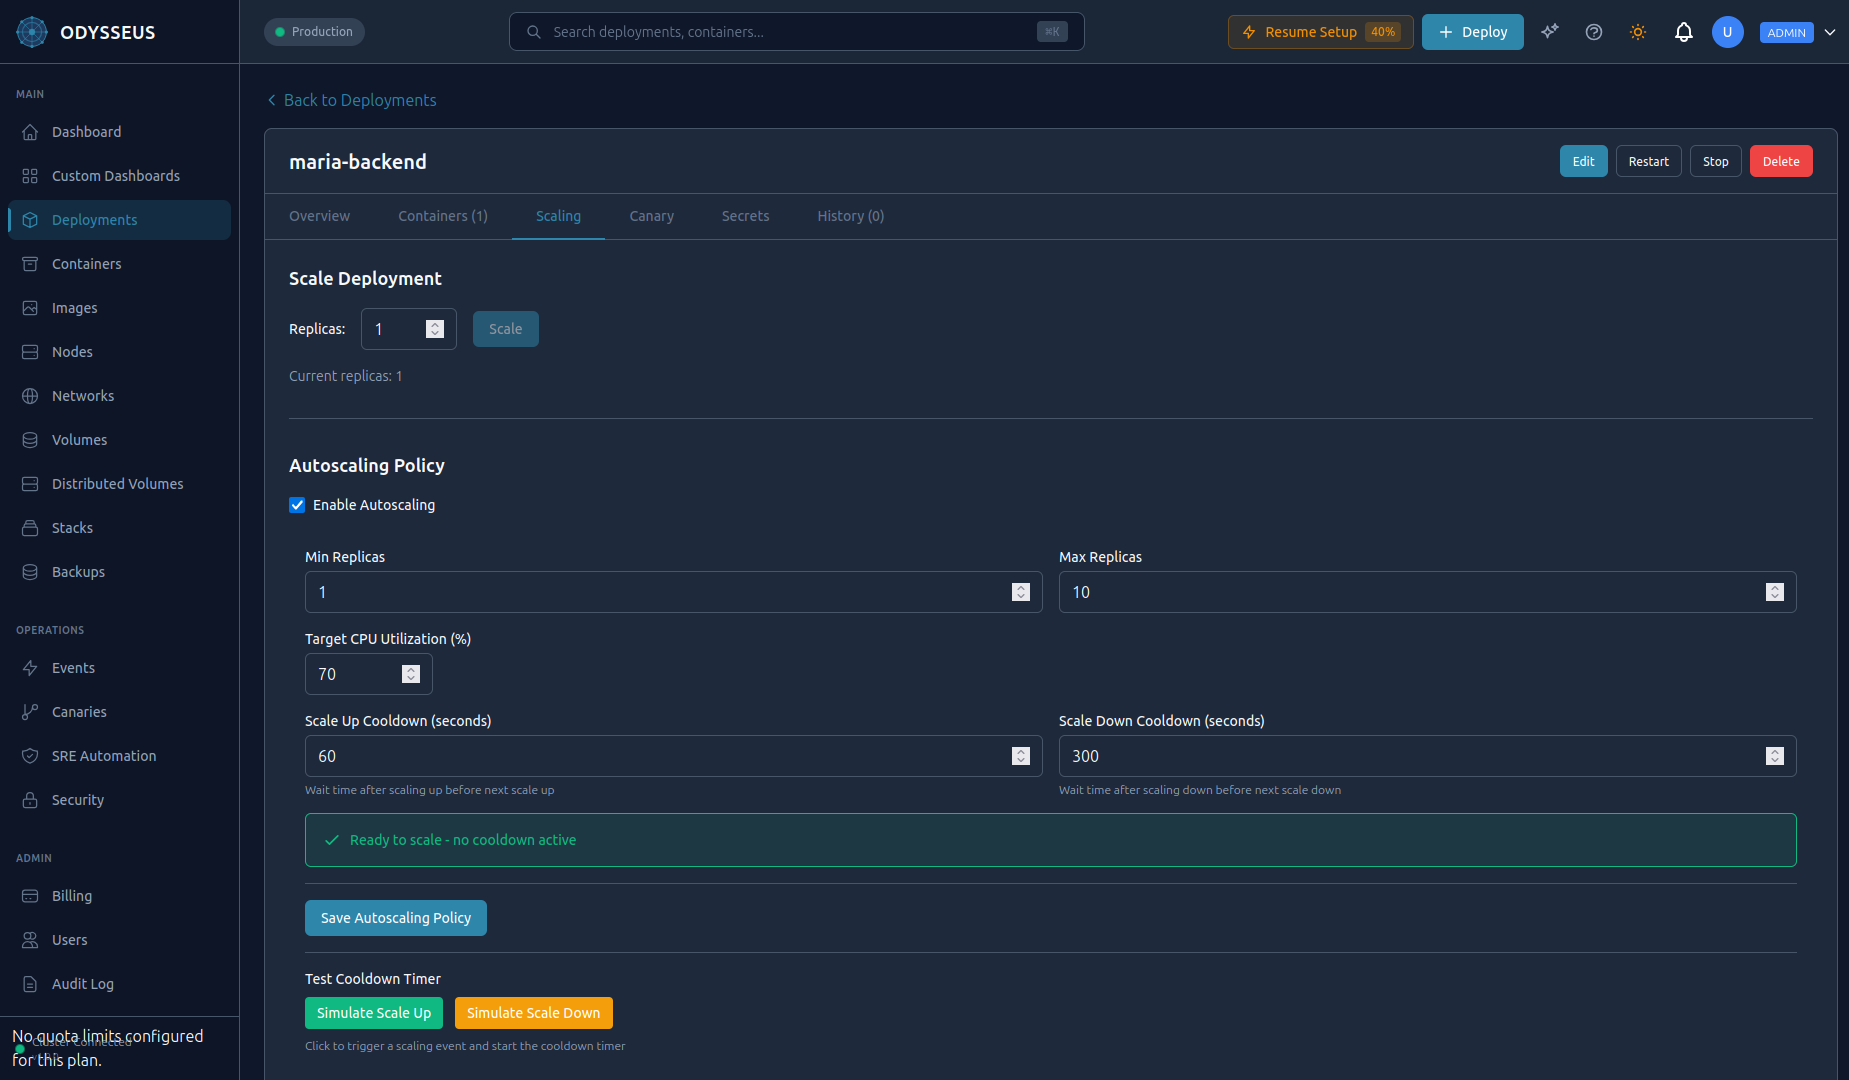
Configuration
Set autoscaling parameters per deployment:
- Min replicas: The floor. Odysseus never scales below this count.
- Max replicas: The ceiling. Odysseus never scales above this count.
- CPU target: The target average CPU utilization percentage across all replicas.
Configure autoscaling in the dashboard under Deployment > Settings > Autoscaling.
How It Works
The autoscaler evaluates metrics every 15 seconds:
- Collects average CPU utilization from Prometheus for all running replicas.
- Compares to the configured target.
- If utilization exceeds the target, scales up. If below, scales down (with a cooldown period to prevent flapping).
- Respects min/max boundaries at all times.
Manual Override
You can manually scale a deployment at any time from the dashboard, even when autoscaling is enabled. A manual scale sets the replica count immediately. The autoscaler resumes normal operation after the cooldown period.
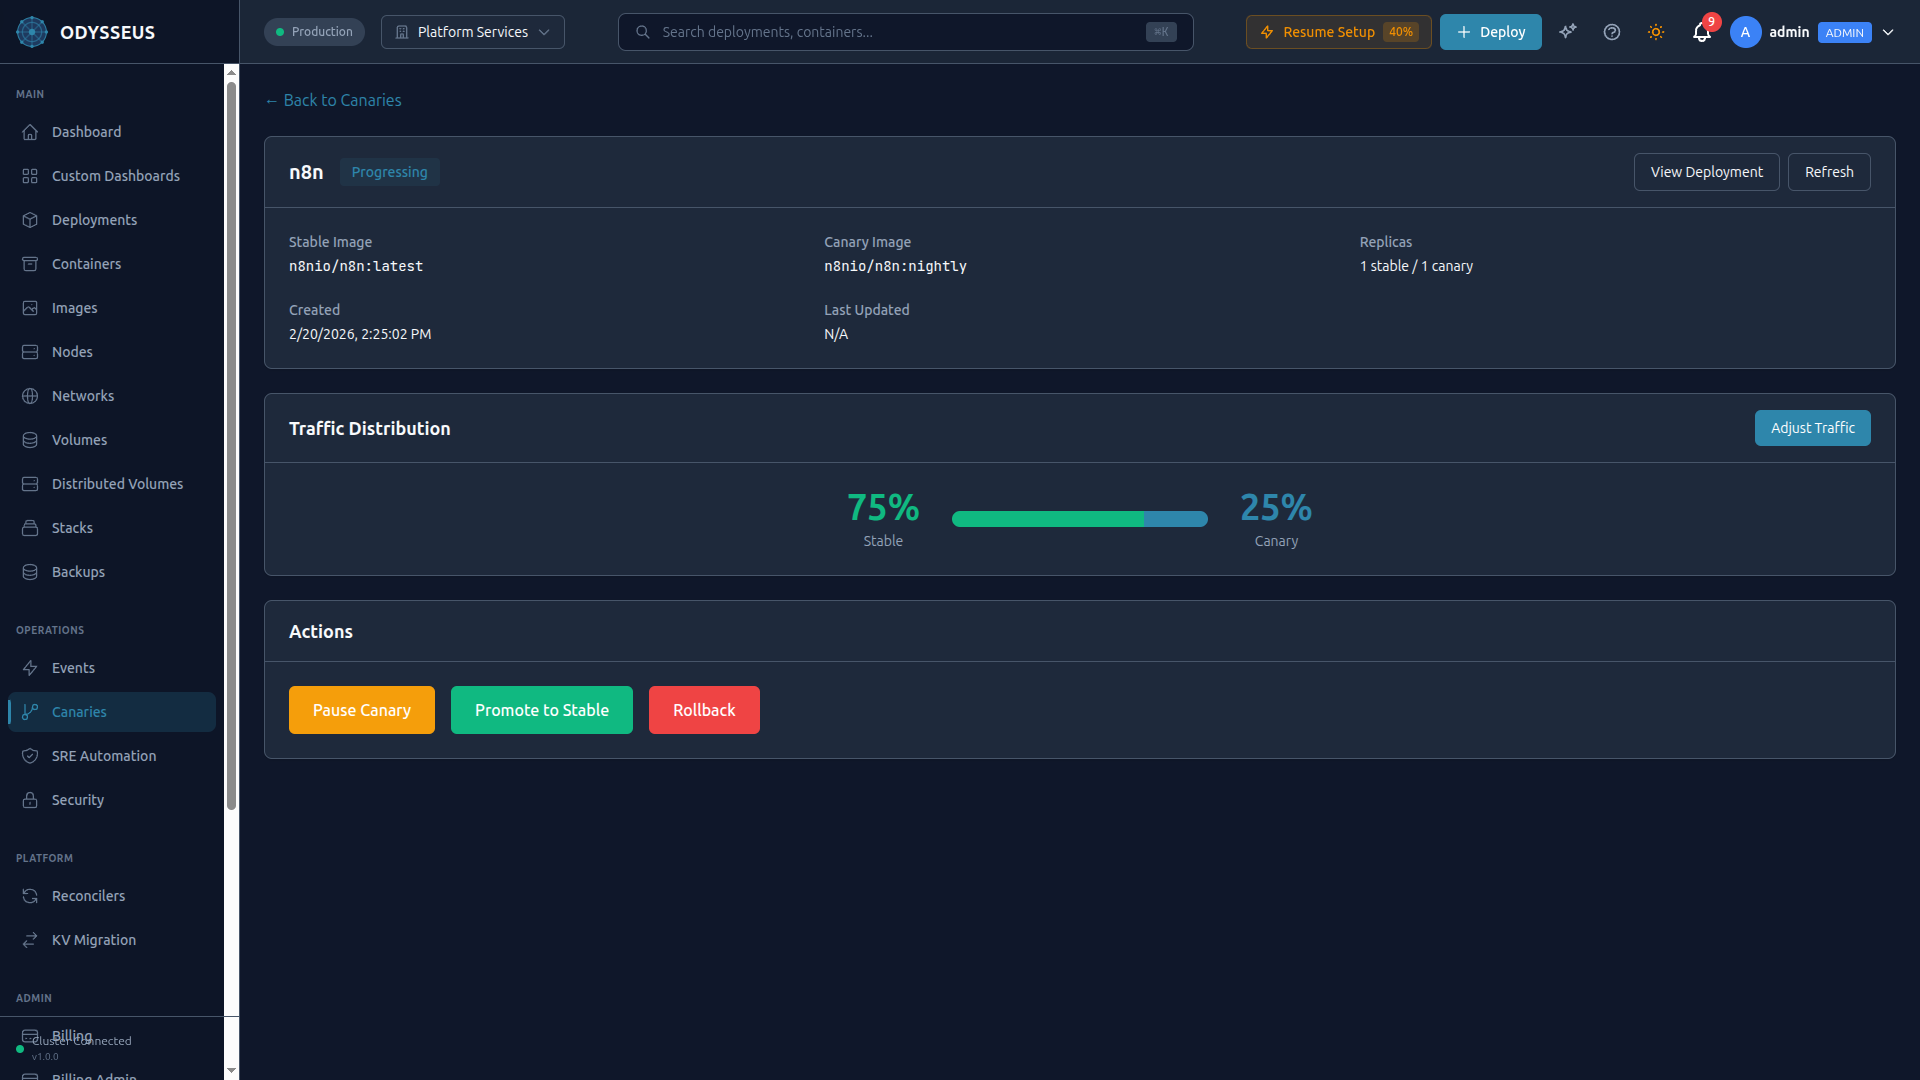
Canary Deployments
Canary deployments let you roll out a new version to a small percentage of traffic, validate its behavior, and then promote it to full production or roll back with zero downtime.
Starting a Canary
Specify the new image and the initial traffic weight (percentage routed to the new version). In the dashboard, click Canary Release on any deployment to open the canary wizard.
Monitoring the Canary
The dashboard shows a real-time comparison between the stable and canary versions:
- Error rate: Percentage of failed requests per version.
- Latency: p50, p95, and p99 response times per version.
- Resource usage: CPU and memory consumption per version.
- Traffic split: Current weight distribution with a visual bar.
Adjusting Traffic Weight
Gradually increase the canary's traffic share as confidence grows using the weight slider in the canary dashboard.
Automatic Promotion and Rollback
Configure health thresholds to let Odysseus decide automatically:
- Auto-promote: If error rate stays below threshold and latency stays within bounds for a configured duration, promote the canary to 100%.
- Auto-rollback: If error rate exceeds the threshold at any point, roll back the canary immediately and restore 100% traffic to the stable version.
Configure these thresholds in the canary wizard when starting a new canary deployment.
Manual Controls
You always retain manual control, even when auto-rules are configured. Use the Promote and Rollback buttons in the canary dashboard to promote to production or roll back instantly.
Athena AI Assistant
Athena is an AI assistant built into the Odysseus dashboard. It understands your infrastructure and can query status, diagnose problems, and execute operations using natural language.
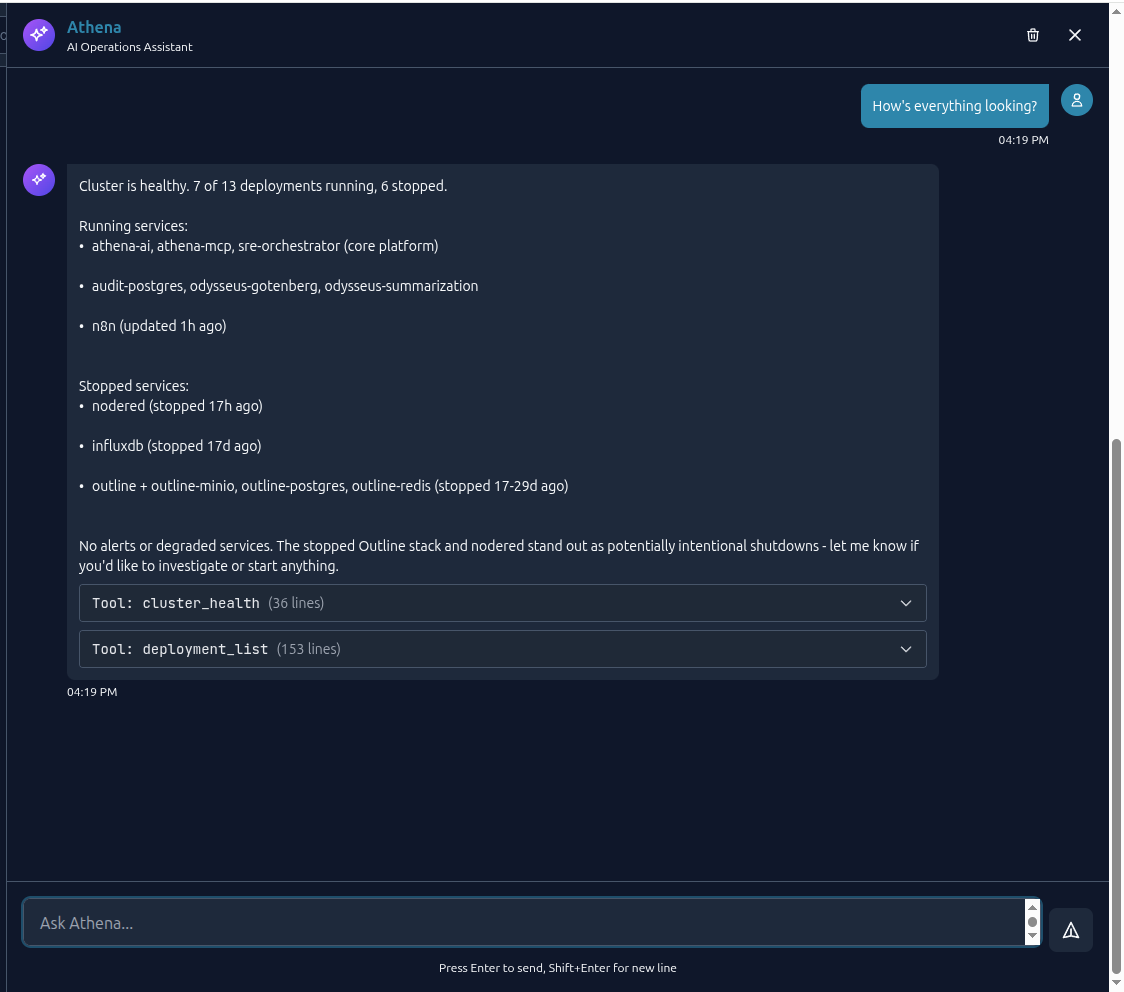
Opening Athena
Click the Athena icon in the bottom-right corner of the dashboard to open the chat panel. It slides out on the right side of the screen. Athena opens with context about the page you are currently viewing -- if you are looking at a specific deployment, Athena already knows which deployment you mean.
What Athena Can Do
Athena has access to 61 operation tools organized across every platform capability:
| Category | Example Commands |
|---|---|
| Deployments | "Scale web-api to 8 replicas", "Update web-api to v3.1", "Roll back web-api" |
| Containers | "Show logs for web-api", "Why is redis restarting?", "List containers on node-2" |
| Canary | "Start a canary for web-api with 10% traffic", "Promote the canary" |
| Cluster | "Show node health", "Which node has the most free memory?" |
| Configuration | "Set environment variable DB_HOST on web-api" |
| Backups | "Create a backup of the postgres volume", "List recent backups" |
| Networks | "Create a network called backend-net", "Attach web-api to backend-net" |
| Volumes | "Create a 50GB volume", "Show volume usage" |
| Audit | "Who scaled web-api yesterday?", "Show audit log for the last hour" |
| SRE | "Show active incidents", "What caused the last outage?" |
RBAC-Scoped Access
Athena respects your RBAC role. The tools available depend on your permissions:
- Admin: Full access to all 61 tools, including destructive operations.
- Operator: Operational tools (scale, restart, canary, backups) but no RBAC or tenant management.
- Developer: Deploy, read logs, view status. No infrastructure changes.
- Read-only: Query and view only. No modifications.
Safety Guardrails
Athena includes built-in safety features:
- Confirmation prompts: Destructive actions (delete, stop, rollback) require explicit confirmation before execution.
- Rate limiting: Prevents runaway automation from rapid-fire commands.
- Secret redaction: Sensitive values are never displayed in chat output.
- Audit trail: Every action Athena takes is recorded in the audit log, attributed to your user account.
CVE Scanner
The built-in CVE scanner checks container images for known vulnerabilities before and after deployment. It uses dual scanning engines for defense in depth.
Scanning Images
Scan an image on demand from the dashboard. Click Scan on any deployment or navigate to Security > CVE Scanner to scan an image by name.
Dual-Engine Scanning
Odysseus runs two independent scanning engines:
- Trivy (primary) -- Comprehensive vulnerability database with OS package and application dependency scanning.
- Grype (secondary) -- Cross-references findings for defense in depth and catches vulnerabilities one engine may miss.
Results from both engines are merged and deduplicated in the scan report.
Security Policies
Define policies that gate deployments based on scan results:
- Block on critical: Prevent deployment of images with any critical-severity CVE.
- Block on high: Prevent deployment of images with critical or high-severity CVEs.
- Warn only: Allow deployment but flag vulnerabilities in the dashboard.
Policies are configured per organization under Settings > Security Policies.
Patch Recommendations
For each vulnerability, the scanner provides:
- CVE identifier and severity (Critical, High, Medium, Low).
- Affected package and installed version.
- Fixed version (when available) with upgrade instructions.
- Links to the full advisory.
Scheduled Scanning
Enable periodic scanning to catch newly disclosed vulnerabilities in already-deployed images. Configure the scan interval (e.g., daily, weekly) under Settings > Security Policies > Scheduled Scans. Results appear in the dashboard with notifications for new findings.
SRE Automation
Odysseus continuously monitors your workloads and automatically detects and responds to infrastructure incidents.
Automatic Incident Detection
The platform detects these conditions automatically:
- Container crashes: Unexpected exits with non-zero exit codes.
- OOM kills: Containers terminated by the kernel for exceeding memory limits.
- Restart loops: Containers restarting repeatedly within a short window.
- Health check failures: Containers failing their configured health endpoint.
- High CPU/memory: Sustained resource utilization above configured thresholds.
Auto-Remediation
When an incident is detected, Odysseus can take automatic corrective action based on your remediation policies:
- Restart: Restart the affected container.
- Scale up: Add replicas to distribute load.
- Scale down: Remove excess replicas when load subsides.
- Update resources: Adjust CPU or memory limits to match actual usage.
- Stop: Halt a container that is causing cascading failures.
- Run diagnostics: Execute predefined diagnostic commands and capture output for analysis.
Incident Dashboard
The Incidents section in the dashboard provides:
- Active incidents with severity level: Critical, High, Medium, Low.
- Timeline of detection, analysis, and remediation actions taken.
- Root cause summary when available.
- Full incident history with search and filtering.
Configurable Policies
Customize detection thresholds and remediation actions per deployment under Deployment > Settings > SRE Policies. For example, you can set a restart-loop threshold of 5 restarts in 10 minutes, or a CPU alert threshold of 90% sustained for 5 minutes.
Secrets Management
Odysseus provides enterprise-grade secrets management with Vault integration. Secrets are stored encrypted and injected into containers securely.
Storing Secrets
In the dashboard, navigate to Secrets to create and manage secrets. You can store key-value pairs or upload files (e.g., certificates).
Secure Injection
Secrets are injected into containers via tmpfs (RAM-backed filesystem). This means:
- Secrets are never written to disk on the host or inside the container.
- Secrets are never exposed in environment variables, preventing accidental leaks in logs, crash dumps, or process listings.
- Secrets are mounted as files at a path you configure (e.g.,
/run/secrets/database-password).
Automatic Rotation
Enable automatic rotation on any secret. When a secret is rotated:
- The new value is written to the Vault backend.
- Containers using the secret are restarted with the new value.
- Restarts are performed as rolling updates -- zero downtime.
Access Policies
Secrets follow the principle of least privilege. Each secret has an access policy defining which deployments can read it. A deployment can only access secrets explicitly granted to it -- no ambient credentials.
RBAC
Role-Based Access Control governs who can do what on the platform. Every user is assigned one of four roles.
Roles
| Role | Permissions |
|---|---|
| Admin | Full control: manage users, roles, billing, organization settings, all deployments, all nodes, all secrets. Delete operations and RBAC changes. |
| Operator | Operational actions: scale, restart, canary, backups, incident management. Cannot manage users or organization settings. |
| Developer | Deploy applications, read logs, view metrics, manage secrets assigned to their deployments. Cannot modify infrastructure or other teams' deployments. |
| Read-only | View deployments, metrics, logs, and audit records. No modifications. |
Authentication Methods
- JWT tokens: Short-lived tokens issued at login. Used by the dashboard. Automatically refreshed.
- mTLS: Mutual TLS for inter-component communication between the control plane and agents. Managed automatically -- no user configuration required.
Managing Users
Admins manage team members under Settings > Team Members. Invite users by email, assign a role, and revoke access at any time. All role changes are recorded in the audit log.
Volumes and Networks
Persistent Volumes
Create and manage persistent volumes for stateful workloads (databases, file storage, caches) from the dashboard under Volumes. Specify a name and size, then attach the volume to a deployment in the deployment configuration.
Volumes persist across container restarts and redeployments. Data is stored on the node where the volume was created.
Networks
Create isolated Docker networks and attach containers to control communication between services. Manage networks from the dashboard under Networks.
Containers on the same network can communicate using their deployment name as a hostname. Containers on different networks are isolated from each other.
Audit Logging
Every action on the Odysseus platform produces a tamper-evident audit record. Audit logging is always on and cannot be disabled.
What Is Recorded
Each audit entry captures:
- Who: The user (or API key, or Athena on behalf of a user) that performed the action.
- What: The operation performed (e.g., scale deployment, create secret, promote canary).
- When: Timestamp with millisecond precision.
- Outcome: Success or failure, with error details when applicable.
- Context: The affected resource (deployment name, node ID, secret name, etc.).
Querying the Audit Log
Navigate to Audit Log in the dashboard for a searchable, filterable view. Filter by user, action type, resource, date range, or outcome.
Compliance Reporting
Audit logs support compliance requirements for:
- SOC 2: Demonstrates access controls, change management, and monitoring.
- GDPR: Tracks data access and modifications for data subject requests.
Export audit logs in JSON format for integration with your compliance tooling or SIEM system.