Quick Start
Go from zero to a running container in five steps. Odysseus is a fully managed platform -- the control plane is hosted for you. All you need is a Linux server with Docker installed.
Step 1: Sign Up
Create your account at odysseus.delta-telematics.dev. The guided onboarding wizard walks you through initial setup:
- Enter your email and create a password (or sign in with SSO).
- Name your organization and invite team members (optional -- you can do this later).
- Choose your deployment path:
- Single server -- One node for development, staging, or small workloads.
- Multi-node cluster -- Multiple servers for production workloads with scheduling across nodes.
- Edge -- Lightweight nodes at edge locations connected back to the control plane.
After completing the wizard, you land on the dashboard with your unique install command ready to copy.
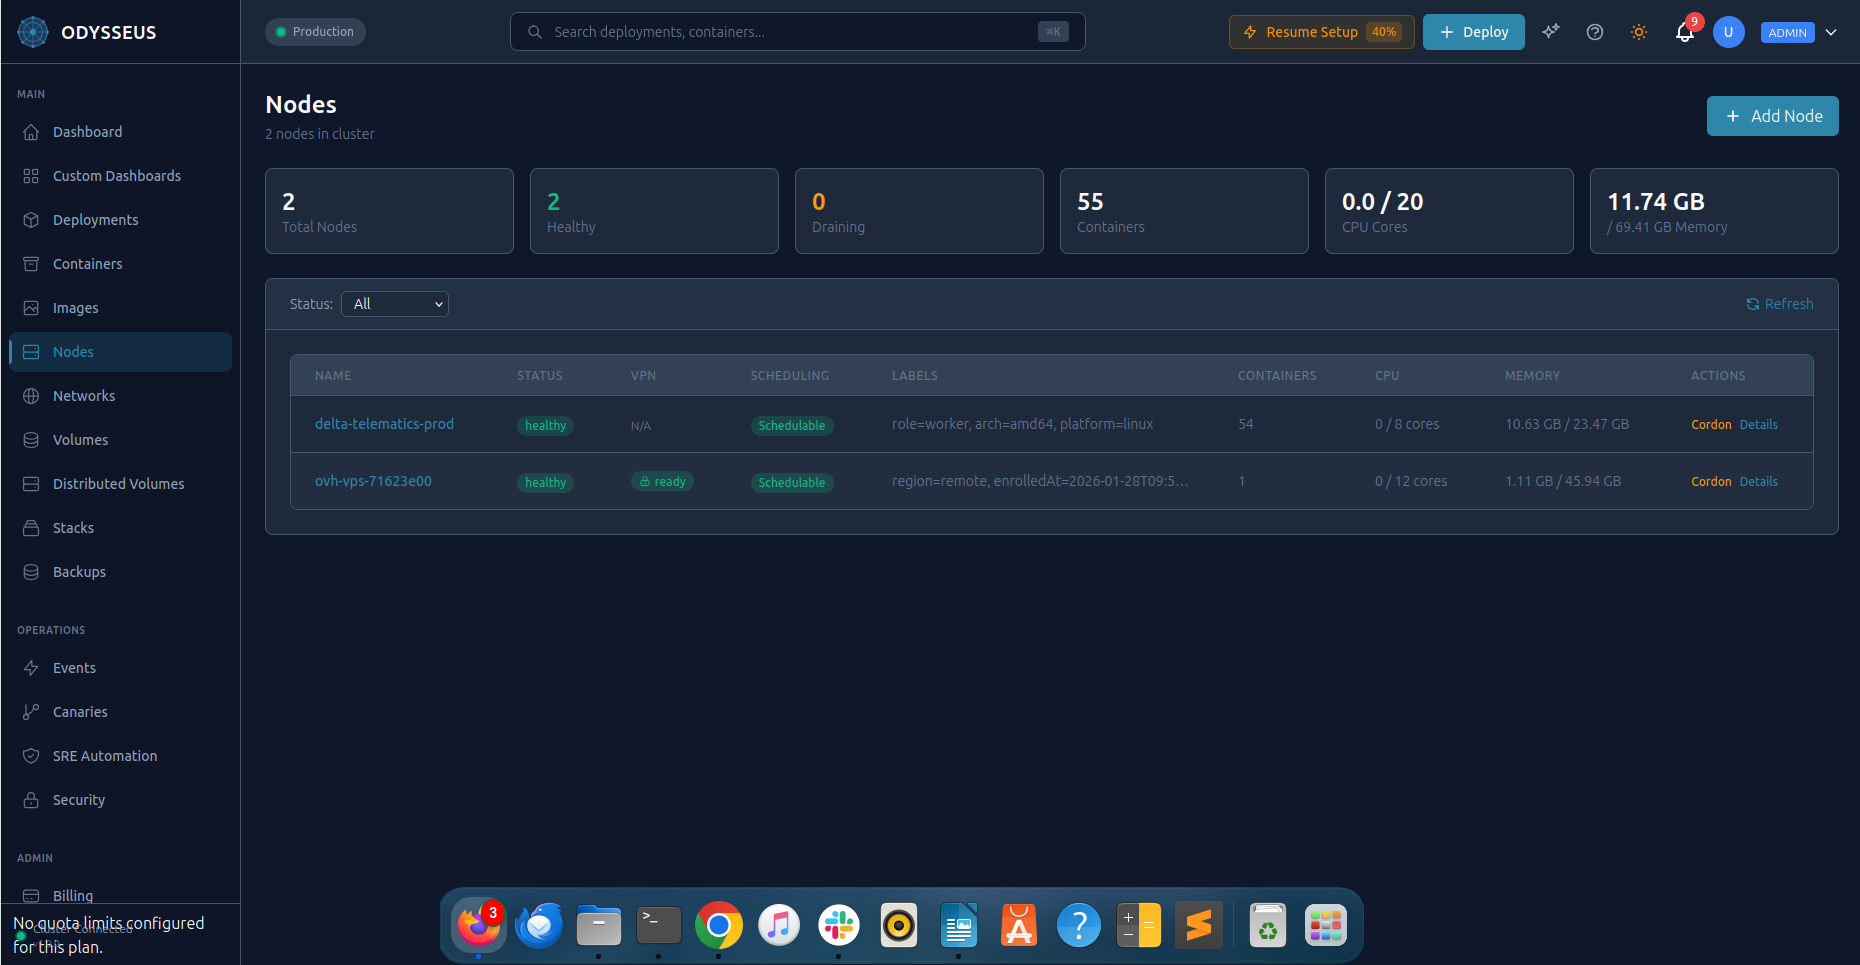
Step 2: Connect Your First Node
Run the one-liner install script shown in your dashboard on any Linux server. The script is unique to your account and contains an enrollment token.
Prerequisites
- Operating system: Ubuntu 20.04+, Debian 11+, or RHEL/CentOS 8+
- Docker: Docker Engine 20.10 or later installed and running
- Network: Outbound HTTPS (port 443) to
odysseus.delta-telematics.dev - Network: Outbound UDP port 51820 for WireGuard VPN tunnel
- Permissions: Root or sudo access (for the initial install only)
Network & Firewall Requirements
After enrollment, the agent communicates with the control plane over an encrypted WireGuard VPN tunnel. The following ports must be open on the WireGuard interface (wg0) for the node to function correctly:
| Port | Protocol | Purpose |
|---|---|---|
8081 |
TCP | Container API — control plane sends deployment commands to the agent |
9501 |
TCP | Metrics and health endpoint — used by monitoring and health checks |
8300 |
TCP | Consul RPC — catalog synchronization between node and control plane |
8301 |
TCP + UDP | Consul gossip — cluster membership and failure detection |
wg0), not on the public internet. Traffic flows exclusively through the encrypted VPN tunnel. If your server has a restrictive firewall, open these ports with:
sudo iptables -I INPUT -i wg0 -p tcp --dport 8081 -j ACCEPT
sudo iptables -I INPUT -i wg0 -p tcp --dport 9501 -j ACCEPT
sudo iptables -I INPUT -i wg0 -p tcp --dport 8300 -j ACCEPT
sudo iptables -I INPUT -i wg0 -p tcp --dport 8301 -j ACCEPT
sudo iptables -I INPUT -i wg0 -p udp --dport 8301 -j ACCEPT
The install script checks for these ports automatically and provides instructions if any are blocked.
Install the Agent
Copy the command from the dashboard and run it on your server:
curl -fsSL https://odysseus.delta-telematics.dev/install | sudo bash -s -- --token YOUR_ENROLLMENT_TOKENThe install script performs three actions:
- Installs the Odysseus agent -- a lightweight binary that manages containers on this node.
- Establishes an encrypted WireGuard VPN tunnel to the control plane for secure communication.
- Registers the node with your account and reports its capacity (CPU, memory, disk).
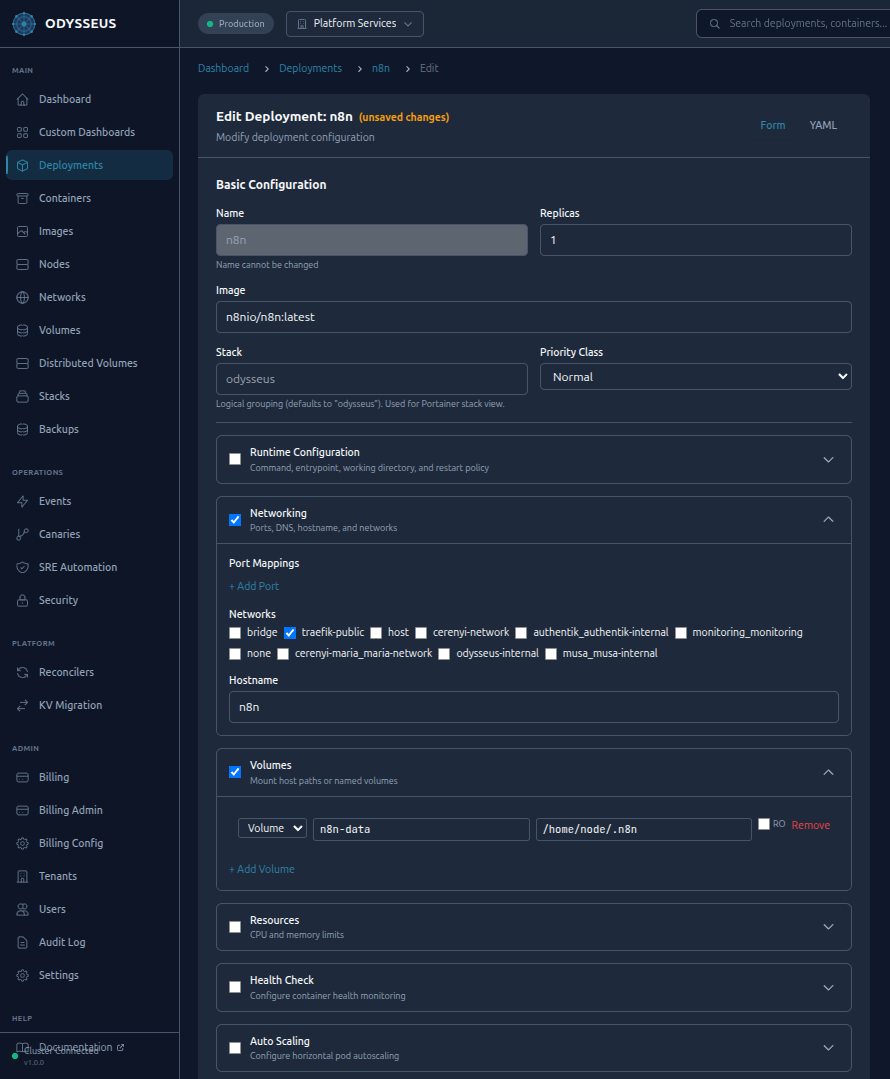
Step 3: Deploy Your First Container
Deploy your first container using the dashboard.
Dashboard
Click New Deployment in the dashboard. Fill in the form:
- Name:
hello-web - Image:
nginx:alpine - Replicas:
2 - Port:
80
Click Deploy. Odysseus validates the configuration, schedules containers across your nodes, pulls the image, and starts the containers.
Step 4: Scale and Monitor
Your deployment is running. Now scale it and observe the metrics.
Manual Scaling
Scale from the dashboard by editing the deployment and adjusting the replica count.
Autoscaling
Enable autoscaling from the deployment settings to let Odysseus manage replica counts automatically based on CPU utilization. Set a target CPU percentage and min/max replica bounds.
Prometheus metrics drive scaling decisions. The autoscaler evaluates metrics every 15 seconds and adjusts replicas to keep CPU utilization near your target.
Monitoring
The dashboard displays real-time metrics for every deployment:
- CPU and memory usage per container
- Request rates and error rates
- Container health status and restart counts
- Autoscaler decisions and scaling history
Step 5: Explore Advanced Features
You have a running, scalable deployment. Here is what to explore next:
| Feature | What It Does | Try It |
|---|---|---|
| Canary Deployments | Roll out a new image version to a percentage of traffic, monitor health, and promote or roll back. | Dashboard > Deployment > Canary Release |
| Athena AI | Ask questions and run operations in natural language from the dashboard chat panel. | Open the Athena panel and type: "Show me the status of hello-web" |
| CVE Scanning | Scan images for known vulnerabilities before deploying them. | Dashboard > Security > CVE Scanner |
| Secrets | Store sensitive values and inject them into containers securely. | Dashboard > Secrets > Create Secret |
| RBAC | Invite team members with scoped roles: Admin, Operator, Developer, or Read-only. | Dashboard > Settings > Team Members |
| Audit Log | View a tamper-evident record of every action taken on the platform. | Dashboard > Audit Log |
Next Steps
- Read the User Guide for in-depth coverage of every feature.
- Review Security to understand the platform's security model.
- Check Integrations to connect Odysseus with your CI/CD pipeline and monitoring stack.