Integrations
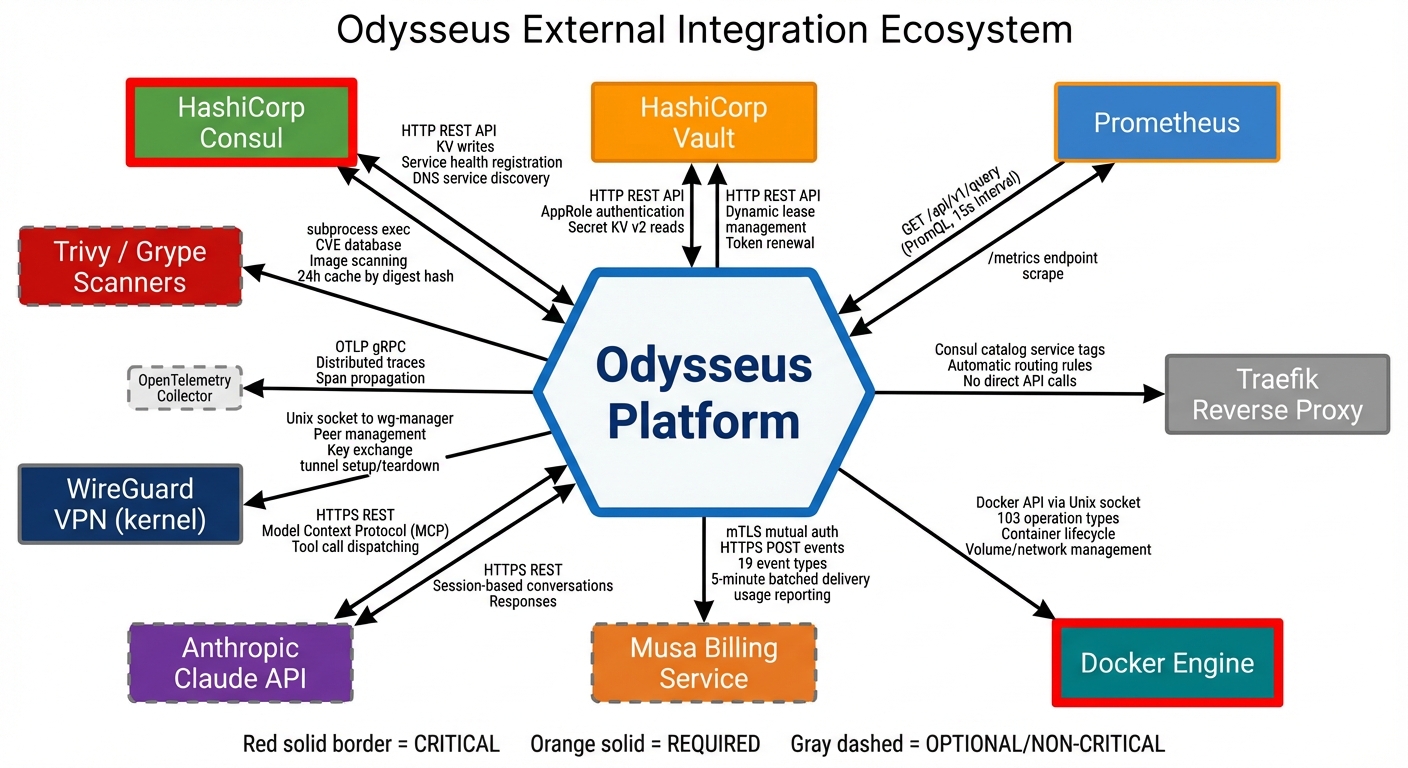
Odysseus integrates with best-in-class infrastructure tools to deliver a fully managed container orchestration platform. All integrations are managed by the control plane — you interact with them through the dashboard.
Consul — Service Discovery & State Coordination
Purpose
Consul provides distributed service discovery and state coordination across the Odysseus platform. It maintains the authoritative registry of nodes, deployments, and configuration state.
How Odysseus Uses It
- Node registry: Every enrolled node is registered in Consul with its capabilities, resource availability, and health status.
- Deployment state: Deployment manifests, replica placement, and lifecycle state are stored and coordinated through Consul's key-value store.
- Configuration distribution: Platform configuration is propagated to agents via Consul, ensuring consistent state across all nodes.
- Leader election: Control plane components use Consul for leader election and coordination during high-availability operations.
What You Need to Know
Consul is entirely transparent to users. You never interact with Consul directly. All state is exposed through the Odysseus dashboard. When you view node status, deployment state, or configuration in the dashboard, you are seeing data coordinated by Consul behind the scenes.
HashiCorp Vault — Secrets Management
Purpose
Vault provides secure storage, access control, and automatic rotation for all secrets used by your deployments — API keys, database credentials, certificates, and any sensitive configuration.
How Odysseus Uses It
- Secret storage: All secrets are encrypted at rest in Vault with per-tenant isolation. No tenant can access another tenant's secrets.
- Injection: Secrets are injected into containers via tmpfs-mounted files at runtime. They never touch disk and are not visible in container images or environment variable listings.
- Automatic rotation: Vault rotates secrets on a configurable schedule. Containers receive updated secrets without redeployment.
- Audit trail: Every secret access is logged, providing a complete audit trail of which deployments accessed which secrets and when.
What You Need to Know
Reference secrets in your deployment manifests using Vault paths. The platform handles the rest.
# In your deployment manifest
secrets:
  - path: "secret/myapp/database"
    key: "password"
    mount: "/run/secrets/db-password"
Secrets appear as files inside your container at the specified mount path. Read them from your application code just like any file. When a secret is rotated, the file content updates automatically.
Prometheus — Metrics & Autoscaling
Purpose
Prometheus collects and stores time-series metrics from your containers and nodes. These metrics power the dashboard visualizations, autoscaling decisions, and alerting system.
How Odysseus Uses It
- Container metrics: CPU usage, memory consumption, network I/O, and restart counts are collected automatically for every container.
- Node metrics: Host-level metrics including CPU, memory, disk, and network utilization are collected from every enrolled node.
- Autoscaling engine: Prometheus metrics feed the autoscaling controller. When metrics exceed your configured thresholds, replicas scale up or down automatically.
- Custom metrics: If your application exposes a Prometheus-compatible metrics endpoint, Odysseus will scrape and store those metrics alongside platform metrics.
- Alerting: Define alert rules based on any collected metric. Alerts trigger notifications and can initiate auto-remediation actions.
What You Need to Know
Metrics are available in the dashboard under the Monitoring tab for each deployment and node. To configure autoscaling:
- Navigate to your deployment settings.
- Enable autoscaling and select a metric (CPU, memory, or custom).
- Set a target value (e.g., 70% CPU utilization).
- Set minimum and maximum replica counts.
For custom application metrics, expose a /metrics endpoint in Prometheus exposition format and specify the port in your deployment manifest:
metrics:
  port: 9090
  path: "/metrics"
Traefik — Ingress Routing & Load Balancing
Purpose
Traefik handles all external traffic routing into your containers. It provides automatic HTTPS, load balancing across replicas, and traffic splitting for canary deployments.
How Odysseus Uses It
- Automatic HTTPS: Every deployment that exposes an external endpoint receives a TLS certificate automatically via Let's Encrypt. No manual certificate management required.
- Load balancing: Traffic is distributed across healthy replicas of your deployment. Unhealthy replicas are automatically removed from the rotation.
- Canary traffic splitting: During canary deployments, Traefik handles weighted traffic routing — sending a configurable percentage of traffic to the new version while the rest continues to the stable version.
- Host-based routing: Each deployment gets a unique hostname, and Traefik routes traffic to the correct containers based on the incoming host header.
What You Need to Know
When you create a deployment with an external endpoint, Odysseus configures Traefik automatically. You can customize routing behavior in your deployment manifest:
ingress:
  hostname: "myapp.example.com"
  port: 8080
  tls: true
For canary deployments, traffic weights are managed through the deployment configuration:
# During canary rollout
canary:
  weight: 10    # 10% traffic to new version
  interval: 5m  # Evaluation interval
Traffic weights adjust automatically as the canary progresses through evaluation gates, or you can set them manually from the dashboard.
Docker — Container Runtime
Purpose
Docker is the container runtime that executes your workloads on each node. It is the only prerequisite you need to install on your own infrastructure.
How Odysseus Uses It
- Container lifecycle: The Odysseus agent communicates with the Docker API on each node to pull images, create containers, start/stop workloads, and collect logs.
- Image management: Images are pulled from your configured registries (Docker Hub, GitHub Container Registry, private registries) as specified in your deployment manifests.
- Resource enforcement: CPU and memory limits defined in your deployment manifest are enforced by Docker's cgroup integration.
- Health checking: Docker health checks are configured automatically based on your deployment's health check specification.
What You Need to Know
| Requirement | Details |
|---|---|
| Minimum Docker version | 24.0 or later |
| Docker Compose | Not required — Odysseus manages containers directly |
| Docker Swarm / Kubernetes | Not required — Odysseus replaces these orchestrators |
| Registry authentication | Configure private registry credentials in the dashboard under Settings > Registries |
WireGuard — Encrypted Networking
Purpose
WireGuard provides encrypted network tunnels between the Odysseus control plane and your nodes. All management traffic — commands, state synchronization, metrics, and logs — travels through encrypted WireGuard tunnels.
How Odysseus Uses It
- Control plane connectivity: Every agent establishes a WireGuard tunnel back to the control plane during enrollment. This tunnel carries all orchestration traffic.
- Multi-node mesh: When deployments span multiple nodes, WireGuard provides encrypted node-to-node communication for service discovery and internal networking.
- NAT traversal: WireGuard handles nodes behind NAT, firewalls, and dynamic IP addresses without requiring inbound port forwarding.
- Key rotation: WireGuard keys are rotated automatically by the control plane on a regular schedule.
What You Need to Know
WireGuard is set up automatically during agent installation. No manual configuration is needed. The only network requirement is that your node can make outbound UDP connections to the control plane.
| Requirement | Details |
|---|---|
| Protocol | UDP |
| Direction | Outbound from node to control plane |
| Firewall rule | Allow outbound UDP to the Odysseus control plane endpoint |
| Kernel module | WireGuard kernel module (included in Linux 5.6+; installed automatically on older kernels) |
Trivy & Grype — Vulnerability Scanning
Purpose
Trivy and Grype are dual-backend container image vulnerability scanners. They detect known vulnerabilities (CVEs) in your container images before and during deployment.
How Odysseus Uses It
- Dual-scanner architecture: Both Trivy and Grype scan every image independently. Results are merged and deduplicated to minimize false negatives — a vulnerability caught by either scanner is reported.
- Pre-deployment gating: Security policies can block deployments if images contain vulnerabilities above a severity threshold (e.g., block any image with Critical CVEs).
- Continuous scanning: Deployed images are re-scanned periodically as new CVE data becomes available. You are notified if a running deployment becomes vulnerable.
- Patch recommendations: When a vulnerability has a fix available, the scan report includes the patched package version.
What You Need to Know
Vulnerability scanning is available from the dashboard under Security > CVE Scanner. Click Scan on any deployment or enter an image name directly.
Configure security policies to enforce scanning requirements:
| Policy Setting | Description |
|---|---|
| Block on Critical | Prevent deployment if Critical CVEs are found |
| Block on High | Prevent deployment if High or Critical CVEs are found |
| Warn only | Report vulnerabilities but allow deployment |
| Scan on push | Automatically scan new image tags when pushed to a connected registry |
Athena — AI-Powered Operations Assistant
Purpose
Athena is an AI operations assistant powered by a large language model with Model Context Protocol (MCP) integration. It connects to 61 orchestration tools within Odysseus, enabling natural language infrastructure management.
How Odysseus Uses It
- Natural language operations: Ask Athena to perform infrastructure tasks in plain English — deploy services, check status, investigate incidents, and adjust configurations.
- Context-aware: Athena has access to your deployment state, metrics, logs, and configuration through MCP tool connections. It understands your infrastructure context when answering questions or executing actions.
- Incident investigation: When something goes wrong, ask Athena to investigate. It can correlate metrics, logs, and events to identify root causes and suggest remediations.
- Guardrails: Destructive operations require explicit confirmation. Athena respects your RBAC permissions — it cannot perform actions your role does not allow.
What You Need to Know
Athena is available in the dashboard chat panel. Example interactions:
"Show me the status of all my deployments"

"Why is myapp-prod restarting?"

"Scale myapp-prod to 5 replicas"

"What CVEs affect my production deployments?"

"Deploy myapp:v2.1.0 as a canary with 10% traffic"
Athena operates within your RBAC role. A Developer can ask Athena to deploy and view logs, but cannot use it to modify RBAC policies or access other tenants' resources.