Architecture
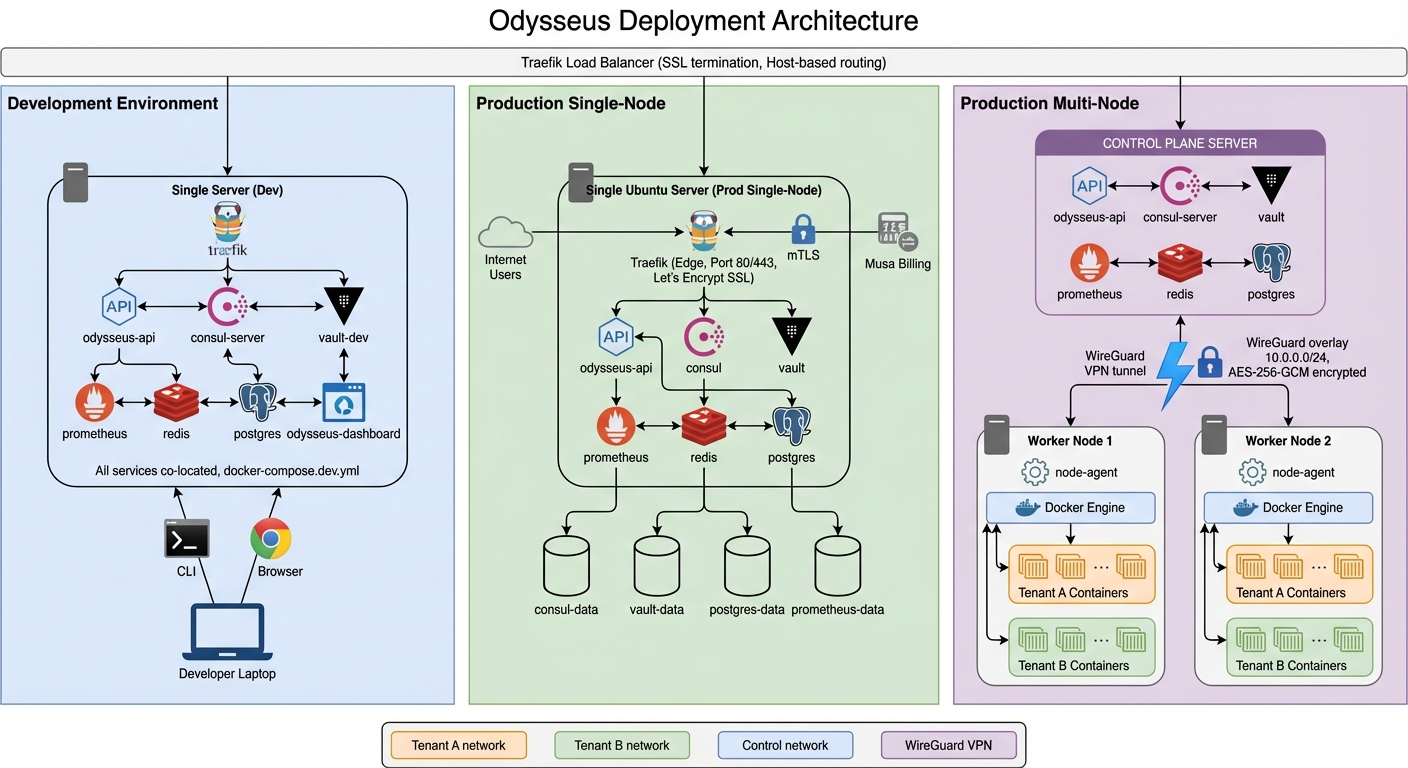
Odysseus uses a hub-and-spoke architecture. The control plane (hub) is fully managed by Delta Telematics. You connect your own servers by installing a lightweight agent (spoke) with a single command. There is nothing to host, patch, or maintain on the control plane side.
Overview
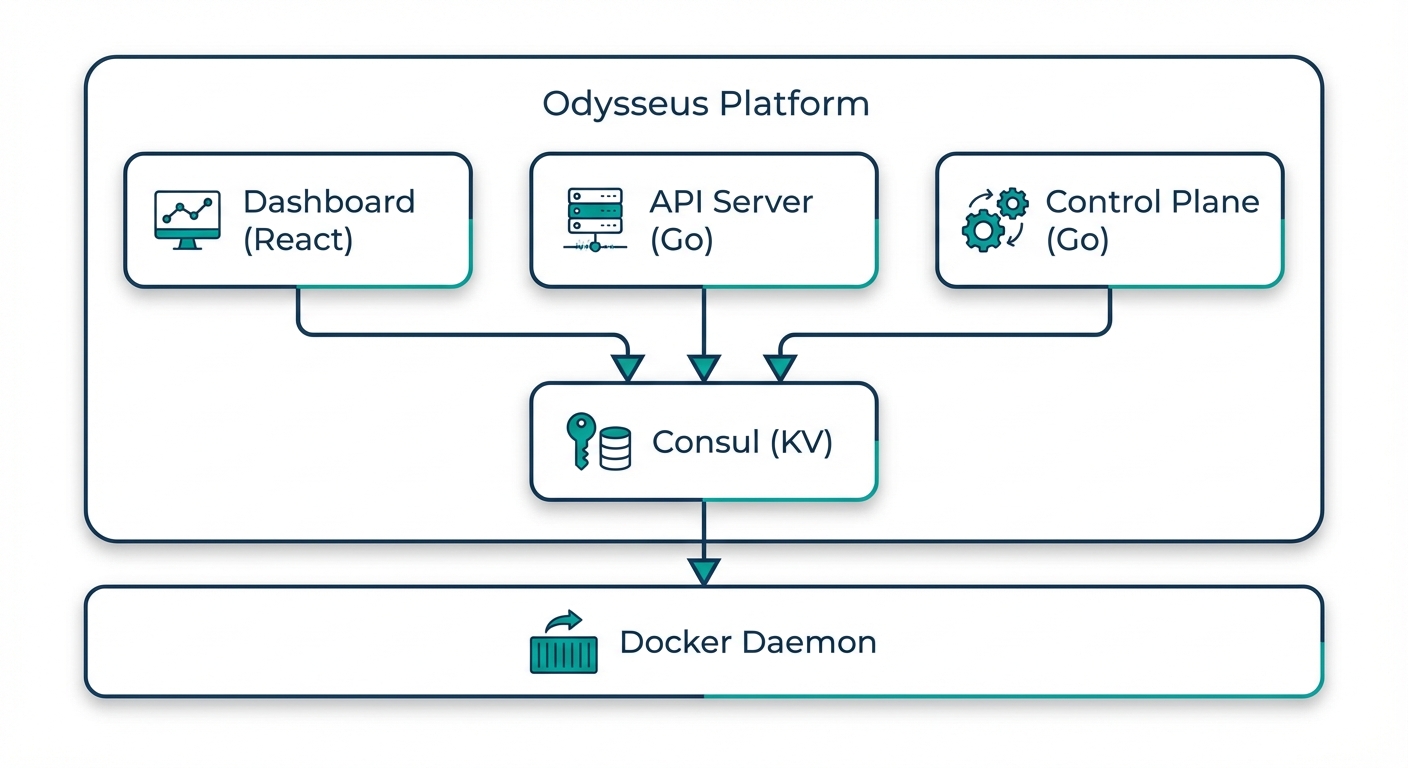
The platform separates concerns into two layers:
- Control Plane (managed) — Hosted by Delta Telematics. Handles orchestration decisions, scheduling, metrics aggregation, the web dashboard, and Athena AI. You interact with it through the dashboard.
- Agent (your infrastructure) — A lightweight process that runs on each of your servers. It receives instructions from the control plane, executes container operations via Docker, and reports health, metrics, and logs back.
Components
Control Plane
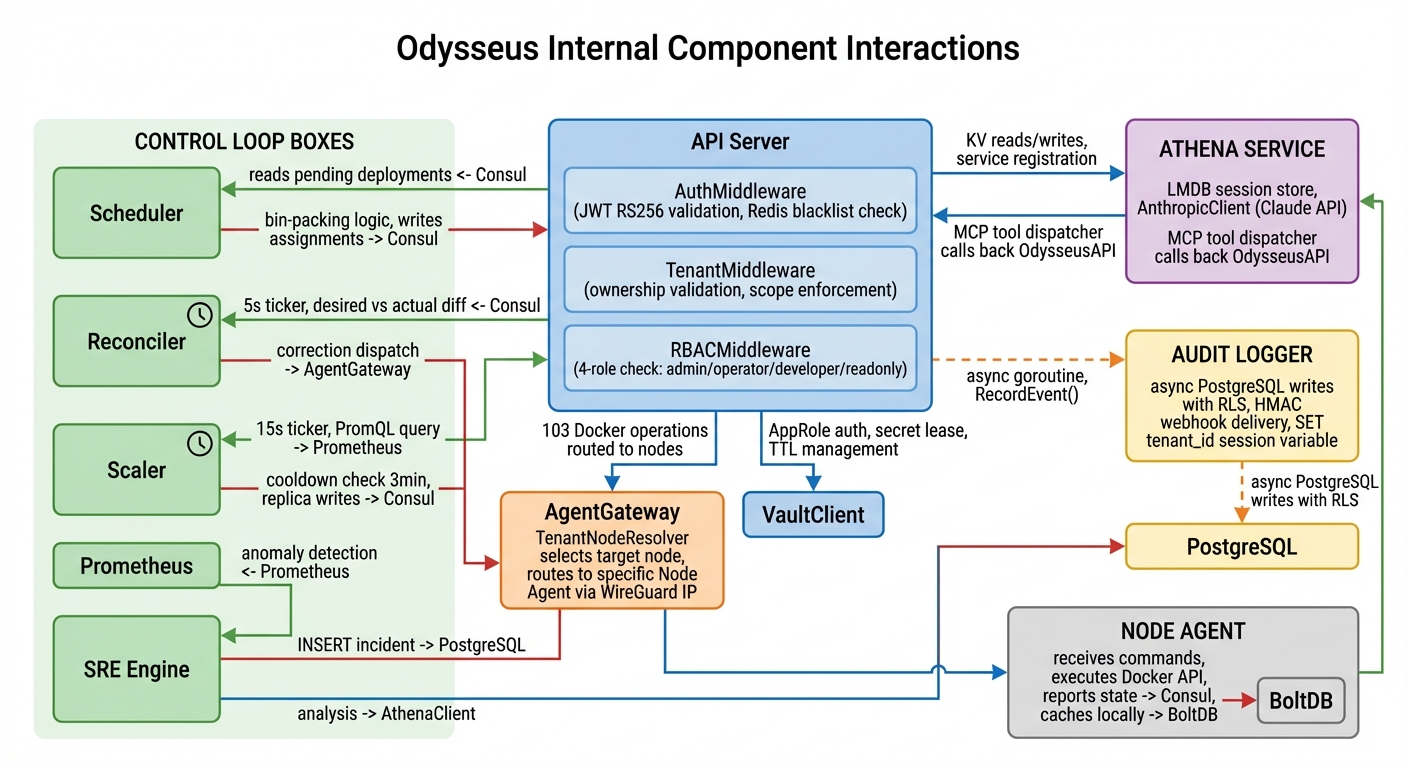
The managed control plane consists of several coordinated services:
| Component | Purpose |
|---|---|
| API Server | REST API gateway that handles all client requests, enforces authentication and RBAC, and routes operations to the appropriate backend service |
| Orchestration Engine | Decides where and how to place containers across your nodes, manages rolling updates, canary deployments, and rollbacks |
| Scheduler | Assigns workloads to nodes based on resource availability, affinity rules, and health status |
| State Store | Maintains the desired state of all deployments and reconciles it with actual state reported by agents |
| Metrics Aggregation | Collects and aggregates metrics from all agents, powering the dashboard, alerting, and autoscaling decisions |
| CVE Scanner | Scans container images using dual backends and enforces deployment-gating policies based on vulnerability severity |
| SRE Engine | Detects anomalies, creates incidents automatically, and can execute approved remediation actions |
Agent
The agent is a single binary that runs on each of your servers. Install it with one command:
curl -sSL https://get.odysseus.delta-telematics.ca | sh -s -- --token YOUR_ENROLLMENT_TOKENThe agent:
- Connects to the control plane over an encrypted WireGuard VPN tunnel
- Executes container lifecycle operations (create, start, stop, remove) via the local Docker daemon
- Streams container logs and resource metrics to the control plane
- Reports node health (CPU, memory, disk, network) at configurable intervals
- Self-updates automatically with health-check-gated rollback
- Continues operating independently if the control plane is temporarily unreachable
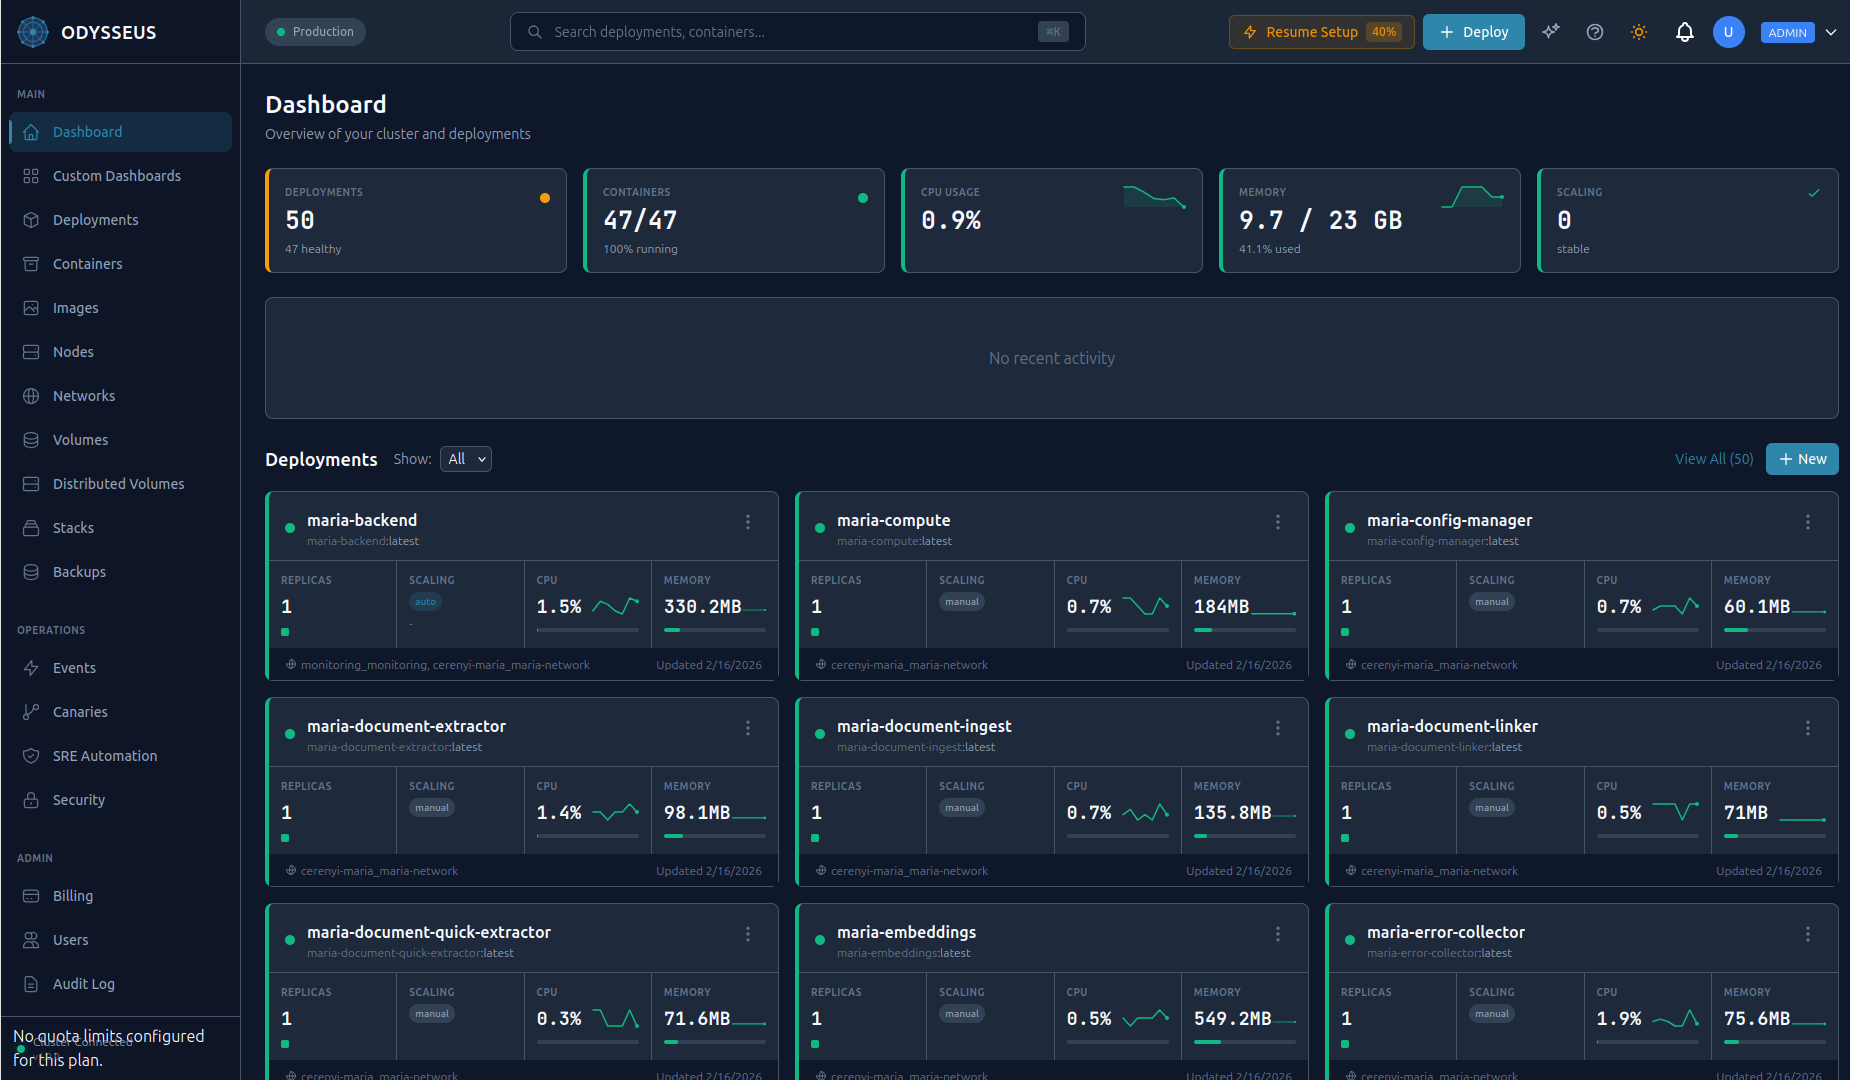
Dashboard
The web dashboard provides a real-time view of your entire infrastructure:
- Deployment management with one-click scaling, restarts, and rollbacks
- Live container logs with search and filtering
- Node health and resource utilization maps
- CVE scan results and security policy management
- Incident timeline with remediation controls
- Athena AI chat for natural-language infrastructure queries
- Audit log viewer with export capabilities
Athena AI
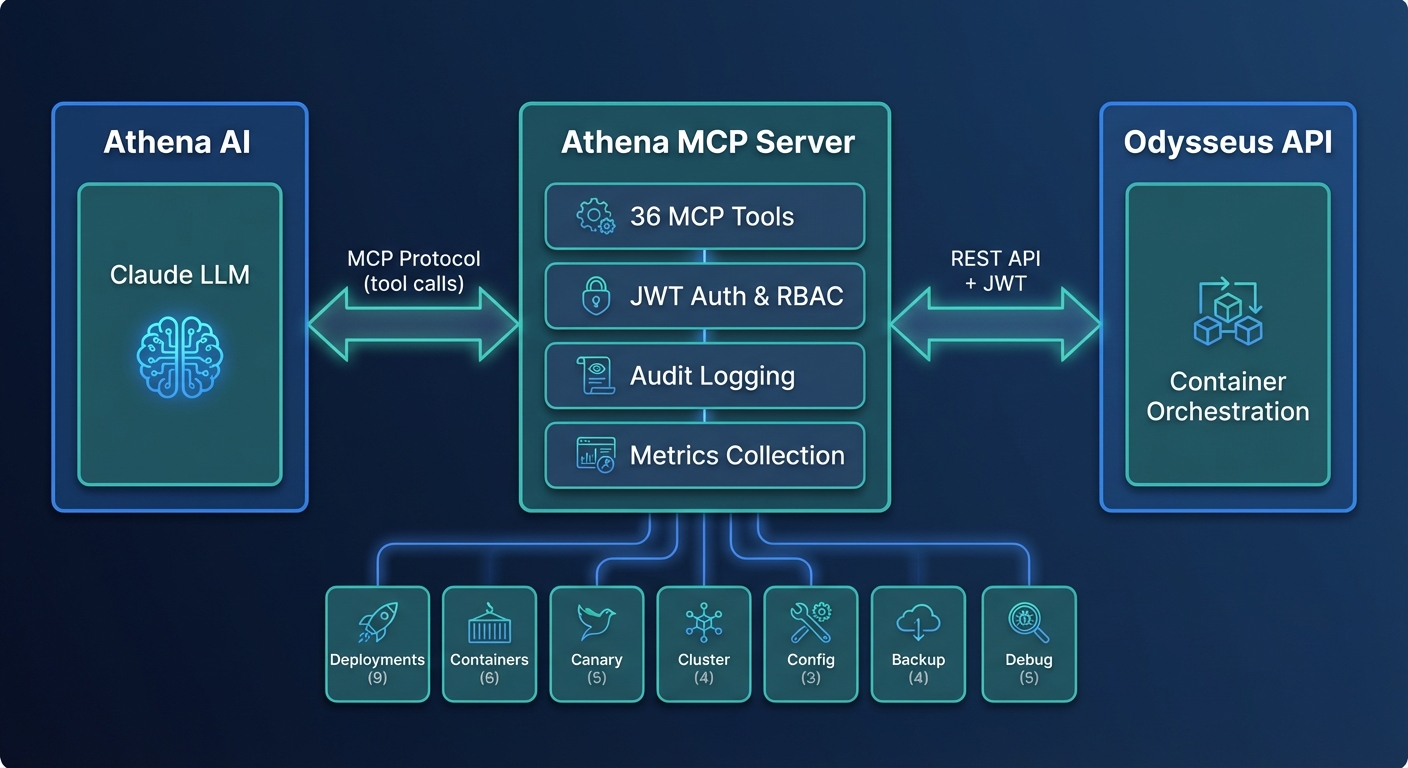
Athena is an AI-powered operations assistant integrated into the dashboard. Powered by a large language model via the Model Context Protocol (MCP), Athena has access to 61 tools that let it:
- Query your deployment state, metrics, and logs
- Diagnose performance issues and suggest optimizations
- Execute operations (with your approval) such as scaling, restarting, or rolling back
- Explain incidents and recommend remediation steps
- Answer questions about your infrastructure in natural language
Data Flow
User Operations
- You issue a command via the Dashboard
- The API Server authenticates the request, checks RBAC permissions, and validates input
- The Orchestration Engine determines how to fulfill the request (which nodes, what order, rollout strategy)
- Instructions are sent to the Agent(s) on the target node(s) over encrypted WireGuard tunnels
- Each Agent executes the container operations via the local Docker daemon
- Results flow back through the same path to confirm success or report errors
Monitoring and Metrics
- Agents continuously collect container and node metrics
- Metrics are streamed to the Control Plane over the encrypted tunnel
- The Metrics Aggregation service processes, stores, and indexes the data
- The Dashboard renders real-time charts, the SRE Engine watches for anomalies, and the Scheduler uses metrics for placement decisions
Log Streaming
- Container stdout/stderr is captured by the Agent
- Logs are forwarded to the Control Plane in real time
- Accessible via the Dashboard log viewer
Key Design Principles
Tenant Isolation
Every layer of the platform enforces strict tenant boundaries:
- Network: Each tenant's containers run on isolated Docker networks with no cross-tenant connectivity
- Data: All queries are scoped to the authenticated tenant at the database layer
- API: Every request is validated against the tenant context in the JWT token
- Resources: CPU, memory, and container count quotas are enforced per tenant
Encrypted Communication
- External traffic: TLS with auto-renewed Let's Encrypt certificates for all public endpoints
- Internal traffic: WireGuard VPN tunnels between the control plane and every agent node
- No plaintext: There is no unencrypted path between any two components
Agent Independence
Agents are designed to operate autonomously:
- Running containers are unaffected by control plane downtime
- Agents queue operations locally if the tunnel is temporarily disrupted
- State is fully reconciled when connectivity is restored
- No customer data is stored on the control plane (agents manage their own Docker state)
Automatic Agent Upgrades
Agents self-update to the latest compatible version:
- New versions are pulled automatically when available
- Upgrades are gated by health checks: if the new version fails its health check, it automatically rolls back
- Zero manual intervention required
Integrations
Odysseus integrates with proven infrastructure tools, all managed for you as part of the control plane:
| Tool | Role |
|---|---|
| Consul | Service discovery and distributed state coordination across nodes |
| Vault | Secrets management with automatic rotation and least-privilege policies |
| Prometheus | Metrics collection, alerting rules, and autoscaling signal source |
| Traefik | Ingress routing, TLS termination, and weighted traffic splitting for canary deployments |
| Trivy + Grype | Dual-backend CVE scanning for comprehensive vulnerability detection |
| WireGuard | Encrypted VPN tunnels for all control-plane-to-agent communication |
Resilience
Odysseus is designed to handle failures gracefully at every level:
| Failure Scenario | Behavior |
|---|---|
| Control plane downtime | Running containers continue operating. Agents queue any pending operations and reconcile when the connection is restored. |
| Network partition | WireGuard maintains persistent tunnels and automatically reconnects. Agents continue local operations during the partition. |
| Agent crash | The agent process is managed by systemd and restarts automatically. Running containers are not affected by agent restarts. |
| Bad agent update | Health-check-gated rollback reverts to the previous agent version within seconds. |
| Node failure | The orchestration engine detects the node as unhealthy and reschedules containers to other available nodes. |
| Container crash | Restart policies and health checks trigger automatic container recovery. Persistent incidents are escalated to the SRE engine. |