Enterprise orchestration.
No Kubernetes required.
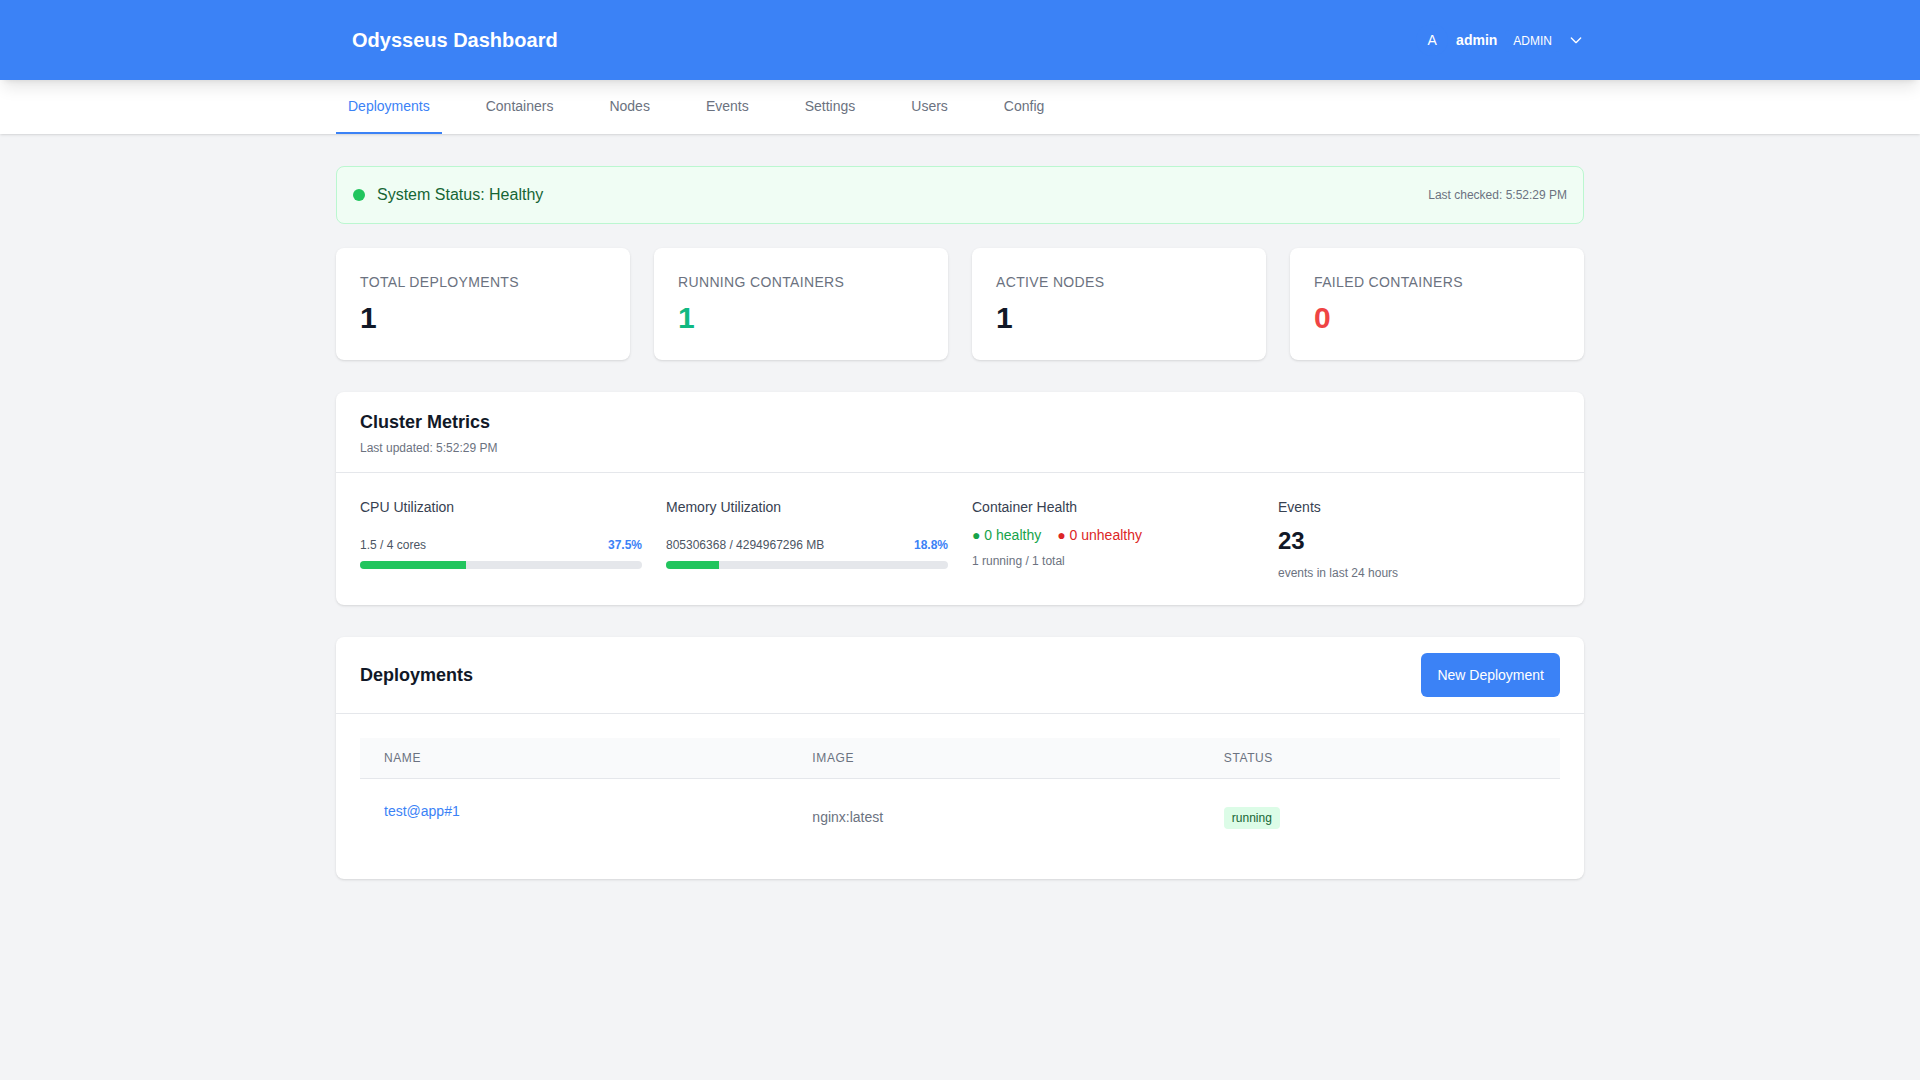
Odysseus is a fully managed container orchestration platform. Sign up, connect your nodes with a one-liner, and get autoscaling, canary deployments, AI-powered operations, and CVE scanning — without the Kubernetes complexity.
Fully managed control plane · One-liner node setup · No dedicated platform team
Odysseus drives live tenant nodes on independent public clouds from a single control plane — a Kubernetes cluster has one control plane per cluster, full stop.
See the multi-cloud proofPer-tenant Vault paths, per-tenant Docker networks, and fail-closed Postgres row-level security — not a namespace label a misconfigured policy can cross.
Read the audit that tested itA hash-chained, tamper-evident event log with a standalone offline verifier you hand to an auditor — not a dashboard screenshot they have to trust.
How the audit trail proves itselfStuck between too simple
and too complex?
Managing 50 or 100 containers shouldn't require a dedicated platform team. But it shouldn't be held together with shell scripts either.
Docker Compose hits its limits
No autoscaling, no high availability, no rolling deploys. One bad push can take down your entire service — and manual recovery takes the team away from shipping.
Kubernetes is overkill
A documented 2 GB minimum per machine, months of ramp-up, 1–2 dedicated engineers to maintain it. At this size you're paying an enterprise tax for features you'll never fully use.
Every deployment is a risk
No canary releases means bugs reach 100% of your users instantly. No audit trail means you can't answer "what changed and when?" for compliance reviews or post-mortems.
- 30–60 minutes of manual deployment steps
- A bad deploy takes down 100% of users
- Scale manually when traffic spikes hit
- No audit trail — "who changed that?" is unanswerable
- Secrets live in environment variables or bash scripts
- Recovery from failure takes 15–30 minutes
- 2–3 minute automated deployments, every time
- Canary releases expose bugs to 10% before full rollout
- Prometheus-driven autoscaling, no manual intervention
- Complete audit trail with actor, timestamp, and outcome
- Read from Vault at create — never stored in Consul, a manifest, or the audit trail
- Instant automated rollback on health check failure
Sign up, connect, deploy
Odysseus is fully managed. Sign up, run a one-liner to connect your nodes, and start deploying — the control plane is on us.
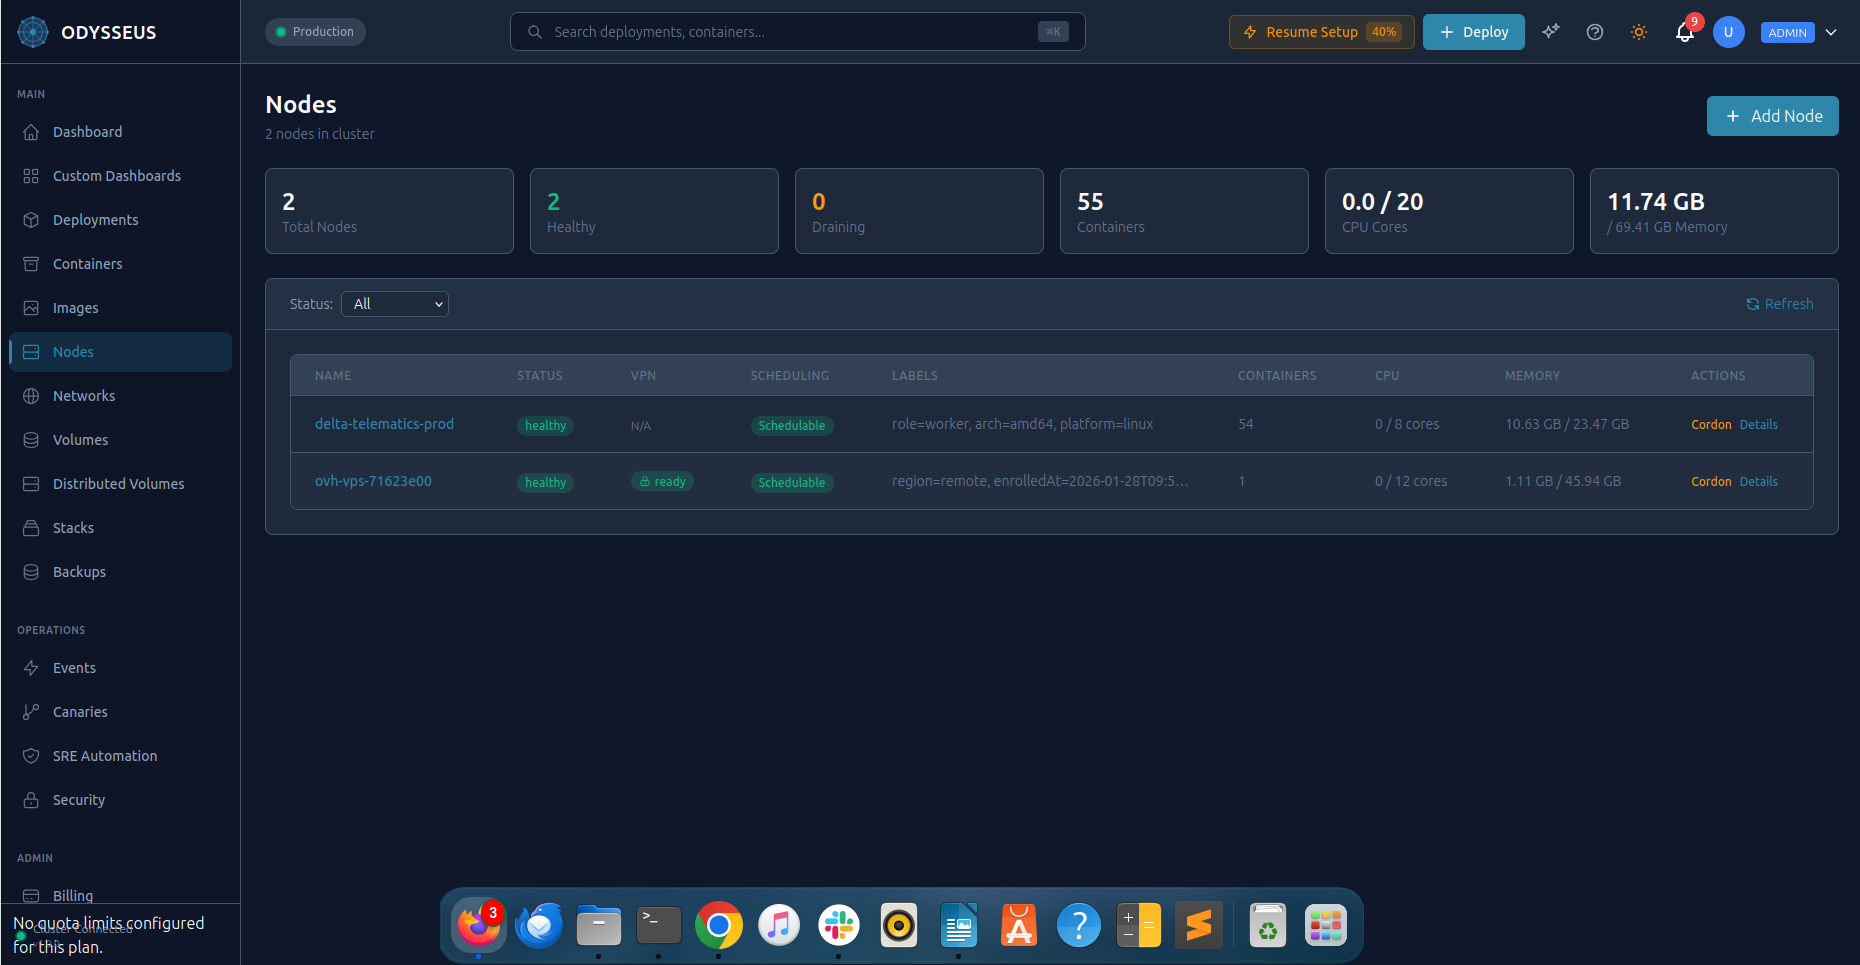
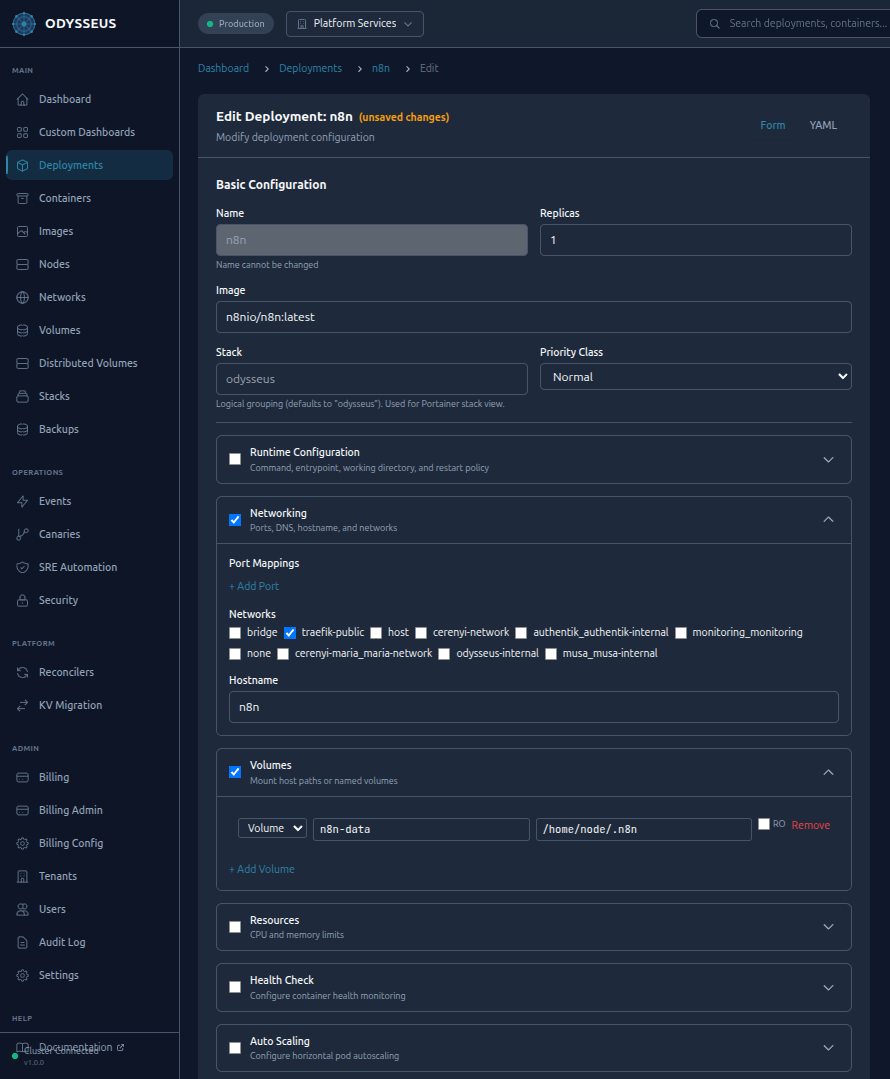
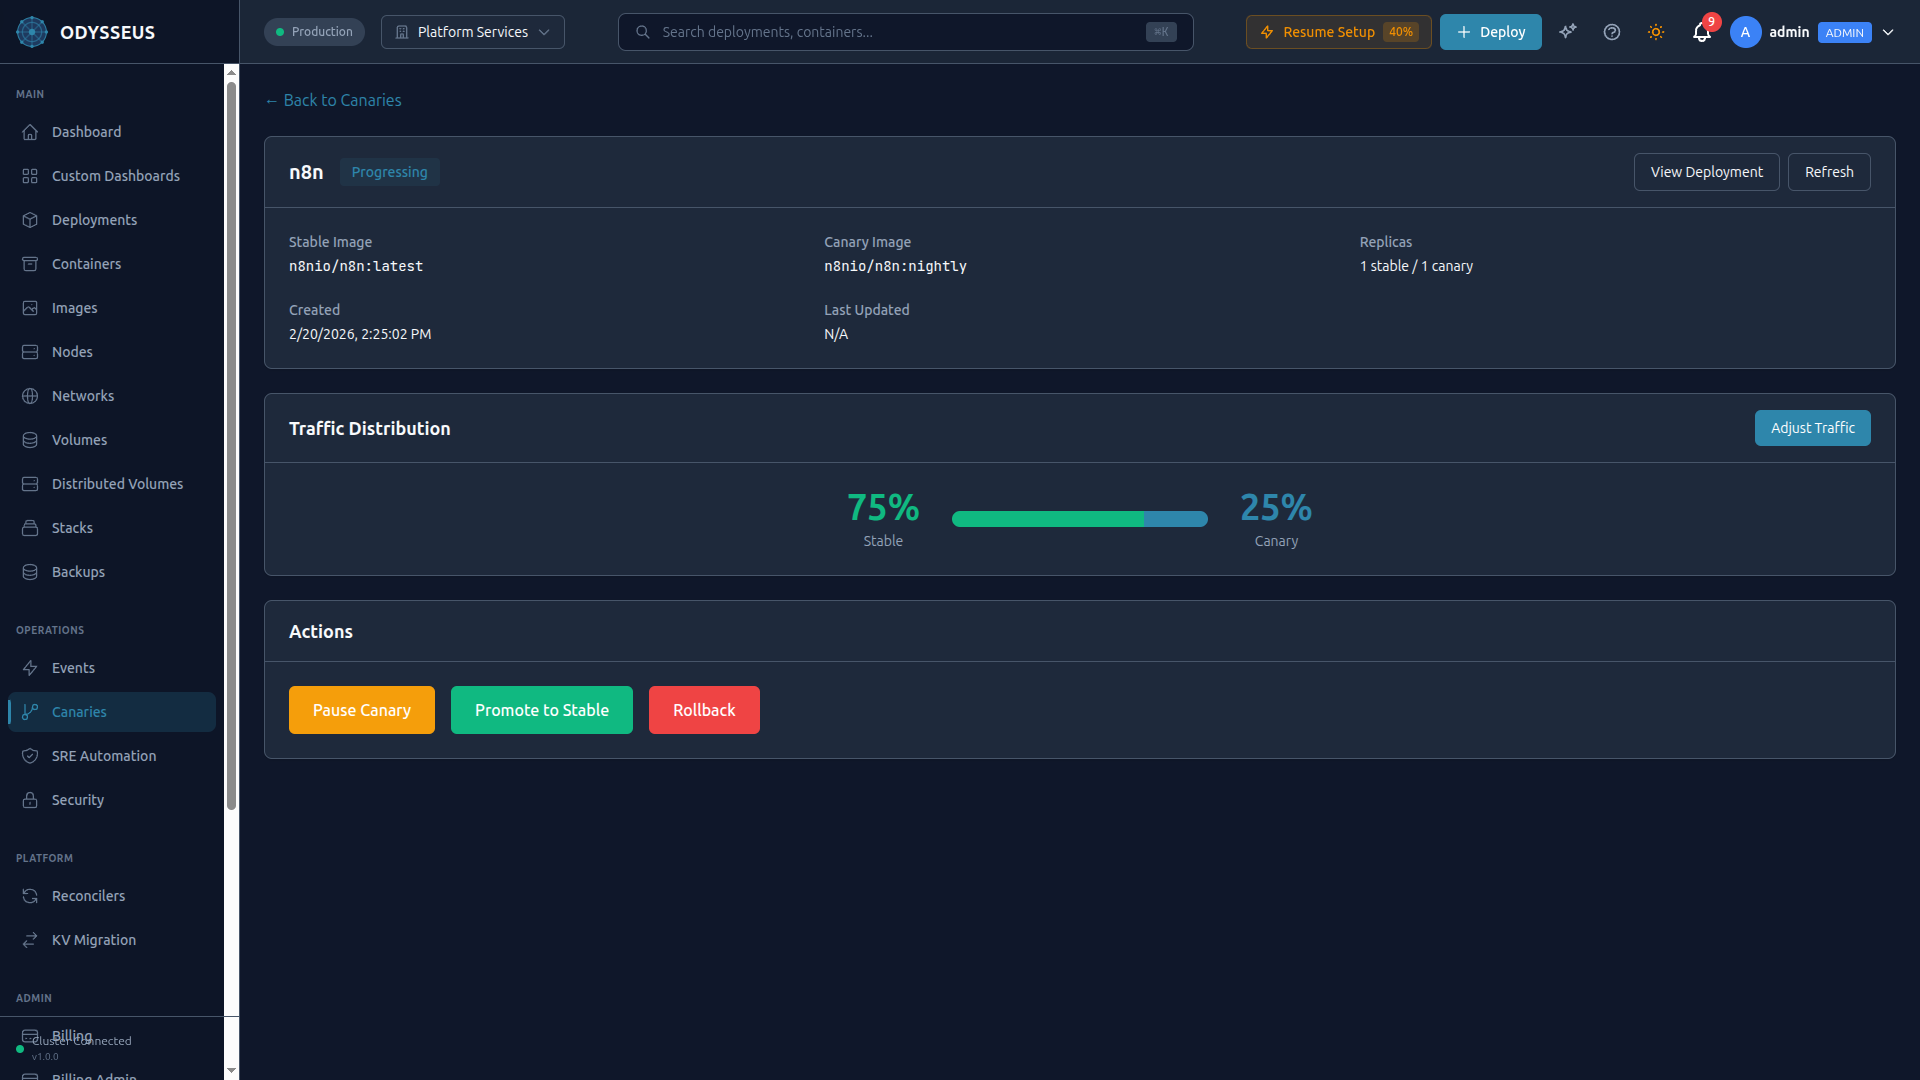
Everything you need.
Nothing you don't.
Built for teams that have outgrown Docker Compose but don't want to build a platform team just to run their containers.
Docker Compose syntax you already know
Extend your existing docker-compose.yml files with an x-odysseus block. No new DSL to learn — your team ships on day one.
Multi-network container attachment
Attach containers to multiple Docker networks simultaneously — a key limitation of Nomad and many other orchestrators that Odysseus solves natively.
Four-tier RBAC
Admin, Operator, Developer, and Read-only roles out of the box. Control exactly who can deploy, scale, or just observe — with JWT + mTLS authentication.
Lightweight agent, zero overhead
The Odysseus agent is a single Go binary that runs on your nodes — about 28 MB of resident memory, measured on live production and development nodes. Installs in seconds, auto-upgrades with health-check-gated rollback.
Automated incident response
Odysseus detects container crashes, OOM kills, restart loops, and health check failures in real time — then executes remediation automatically. Self-healing infrastructure without on-call fatigue.
Built-in CVE scanning
Dual-backend vulnerability scanning with Trivy and Grype. Define policies to block deployments with critical CVEs automatically. Get patch recommendations with severity-based prioritization.
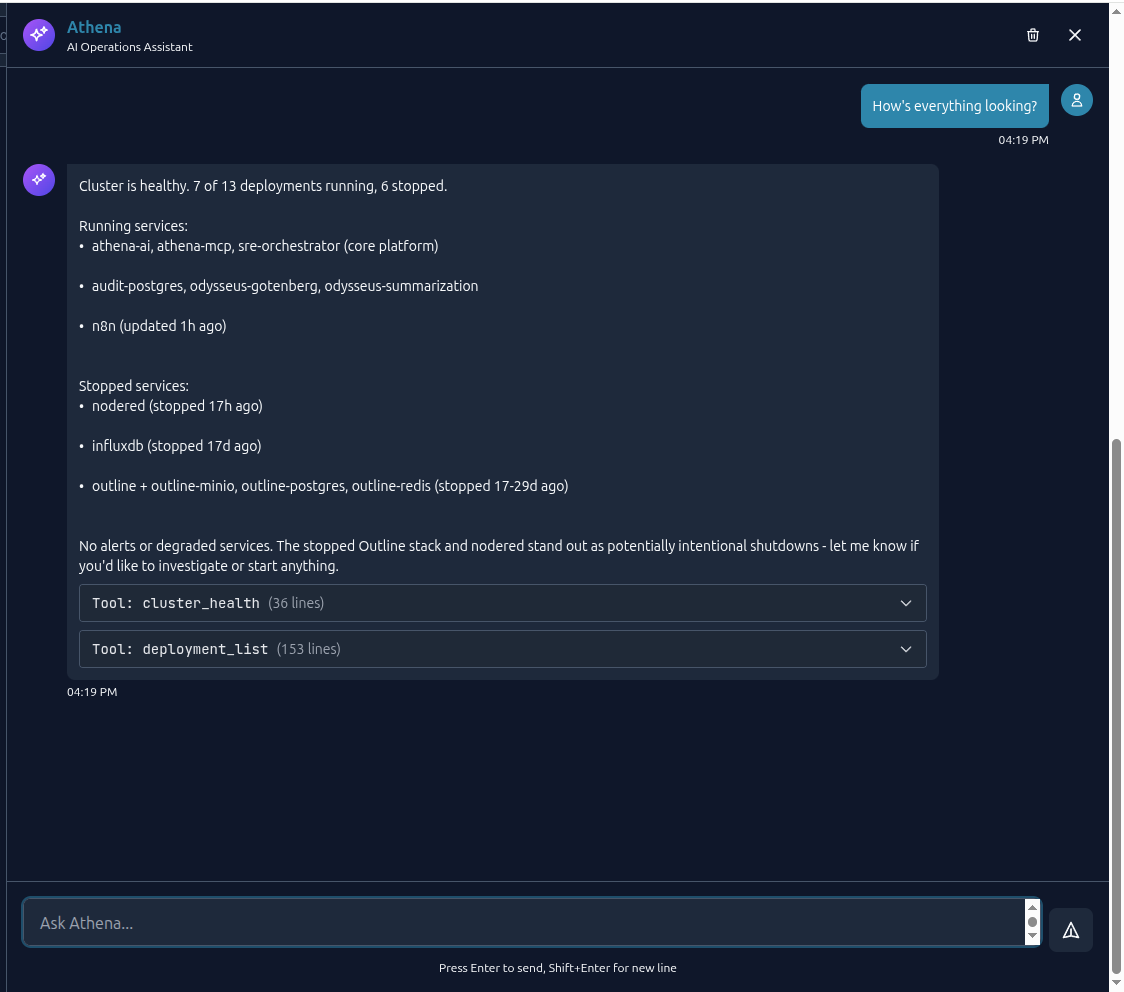
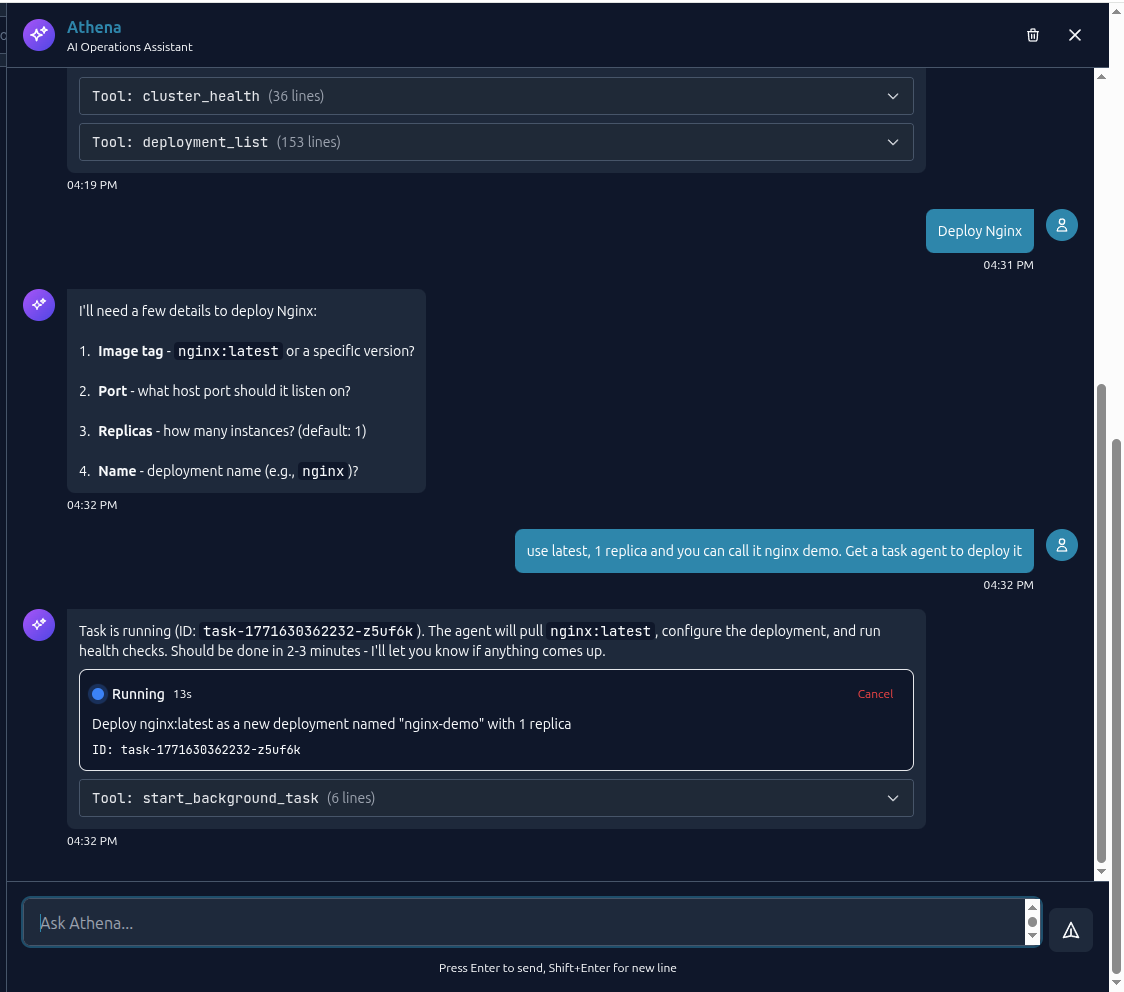
Meet Athena — your AI ops assistant
Deploy, troubleshoot, and manage infrastructure through natural language. Athena connects to 84 orchestration tools[6] with RBAC-scoped access and safety guardrails.
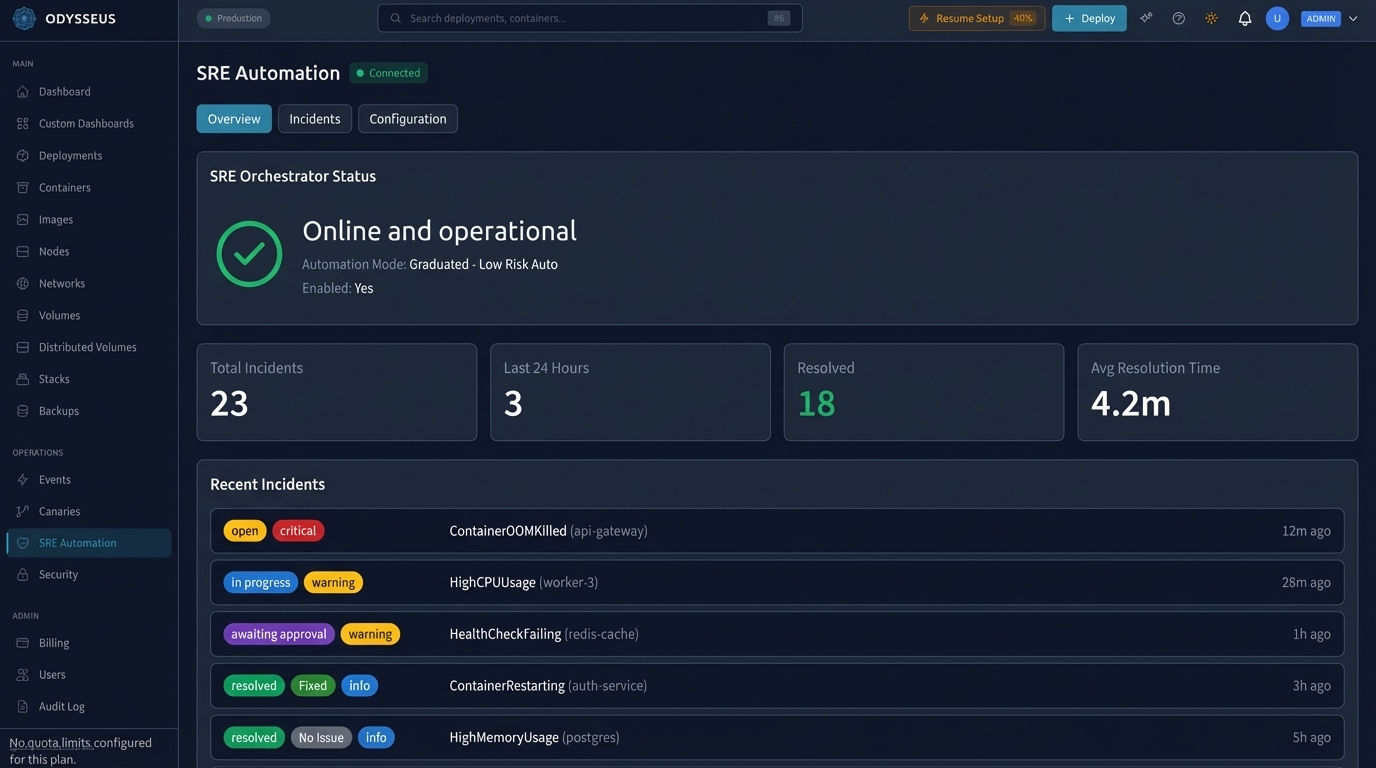
SRE Orchestrator — self-healing infrastructure
Detect container crashes, OOM kills, health check failures, and performance anomalies in real time. An integrated LLM diagnoses root causes and executes safe remediations — with graduated rollout and human approval guardrails.
LLM-powered analysis
Multi-turn AI analysis with configurable timeouts, token limits, and custom system prompts. The LLM investigates, diagnoses, and proposes commands — each tagged with a risk level.
Configurable guardrails
Set max commands per incident, cooldown periods, dangerous command patterns, and per-service blacklists. Control which severities and risk levels can auto-execute.
Full incident lifecycle
Incidents progress through open, in progress, awaiting approval, resolved, failed, or escalated — with deduplication, correlation, and resolution tracking (fixed, dismissed, external, no action needed).
The right tool at 50–100 containers per node — and up from there
Odysseus is purpose-built for the point where Docker Compose breaks down and Kubernetes is more machinery than the job needs — and it keeps going from there. Nomad is the closest peer in this table; where it matches us or beats us, the row says so.
| Capability | Docker Compose | Odysseus | Kubernetes | Nomad[5] |
|---|---|---|---|---|
| Autoscaling | Prometheus-driven | Complex setup | Separate Autoscaler agent | |
| Zero-downtime deployments | Rolling update block |
|||
| Canary deployments | Auto-promote + rollback | Via Istio/Argo | Auto-promote + auto-revert | |
| Instant rollback | Revert to last stable | |||
| RBAC | 4 built-in roles | Complex RBAC | ACL policies and roles | |
| Audit trail | Built-in — hash-chained, independently verifiable | Via add-on | Enterprise only | |
| Vault secret injection | Read from Vault at create, never stored | Via sidecar | Native, tmpfs secrets dir | |
| Geographic data residency | Placement filter, by ISO country or region[1] | Via node affinity on custom labels | Region and datacenter constraints | |
| Tenant isolation | Nodes are enrolled to a tenant | Namespaces; nodes are cluster-scoped | Namespaces; nodes are shared | |
| Multi-network containers | Limited | Native | Via CNI plugin | One network_mode per task |
| Control plane RAM | None — CLI only | 47–65 MB measured | 2 GB minimum per machine[2] | 8–16 GB per server, three or five servers |
| Per-node agent RAM | None — CLI only | ~28 MB measured | 275 MB measured on K3s; 574 MB – 1.9 GB reserved by managed providers[3] | No published figure |
| Learning curve | Hours | Days | Months | Days |
| AI operations assistant | Athena (84 tools)[6] | |||
| CVE scanning | Trivy + Grype | Via add-on | Via add-on | |
| Auto-incident response | AI-powered SRE | Via add-on | Restart and reschedule policies | |
| Dedicated platform staff | 0 | 0 | 1–2 engineers | You run the servers yourself |
| Containers per node | 1–20 containers | 50–100+ containers[4] — the platform total scales with the number of nodes | 110 pods per node[4] — a pod holds one or more containers | No published ceiling — about 330 per client in their own two-million-container run |
How these numbers and claims were arrived at
-
Geographic data residency is a placement filter, and it ships switched off.
A deployment carries
odysseus.io/data-residency-country— an ISO 3166-1 alpha-2 code such asCAorDE— orodysseus.io/data-residency-region, which names an operator-defined set of those codes, orodysseus.io/blocked-countries. The scheduler compares each against the node’s own country and region labels before it places anything, and a node that does not satisfy the requirement is dropped from the candidate set — so the deployment cannot land outside its permitted geography, rather than being found there afterwards. It is switched on per installation in the control plane’s configuration and is off by default; the regions are the operator’s own definitions, not ours. Kubernetes can express the same constraint: it shipstopology.kubernetes.io/regionandtopology.kubernetes.io/zoneas well-known node labels, and node affinity to select on them, but no country or residency label of its own — so residency there is assembled from custom labels and affinity rules — kubernetes.io. The difference is where the concept lives, not whether it can be done. Nomad needs no such assembly and this row is not a differentiator against it: region and datacenter are first-class in its architecture, and a job constrains placement on${node.datacenter},${node.region}or any operator-set${meta.<key>}value. What differs there is vocabulary rather than power — ours is a named residency label carrying ISO country codes and region membership, theirs a general-purpose constraint pointed at whatever the operator wrote on the node. -
Odysseus memory figures are measured, not modelled. Both are resident
memory (RSS) of the running process, sampled over a 14-minute window on 20 August 2026
across two live installations: production (control plane 47–51 MB over 19 samples, node
agent 26–28 MB) and development (control plane 49–64 MB over 18 samples, node agent
26–28 MB). The control plane runs
once per installation; the agent runs once per node. The control plane publishes the
figure itself as
process_resident_memory_byteson its Prometheus/metricsendpoint, so it can be checked directly rather than taken on trust. We quote RSS rather thandocker statsbecause the latter includes reclaimable page cache, which on a freshly started container reads several times higher without any of it belonging to the orchestrator. The Kubernetes figure is the documented minimum in the upstream kubeadm install guide: “2 GB or more of RAM per machine” — kubernetes.io. -
Per-node comparison. Upstream Kubernetes publishes no default reserve
for its node agents —
kubeReservedandsystemReservedboth ship empty — so there is no single official number to quote. The profiled figure is SUSE’s published K3s resource profiling, which puts the Kubernetes components on an agent (worker) node — its words, “the kubelet and k3s agent” — at 275 MB on an Intel 8375C, from 95th-percentile readings at steady state — docs.k3s.io. K3s is a single merged binary with its own embedded runtime, so this is a floor for upstream Kubernetes running the same components as separate processes, not an equivalent. The reserved figures are capacity that managed providers withhold from every worker node before any application container is scheduled, computed from their own published formulas: AWS EKS reserves(11 × max-pods) + 255MiB (574 MiB on an m5.large, which supports 29 pods) — docs.aws.amazon.com; Google GKE reserves 25% of the first 4 GiB and 20% of the next 4 GiB plus 100 MiB (≈1.9 GiB on an 8 GiB node) — cloud.google.com. Reserved capacity is an allowance the scheduler withholds, not measured consumption; we label it as such because the two are not the same thing. - Container counts are per node, and ours is a statement of fit, not a cap. The range describes where Odysseus is designed to sit — above the point where Docker Compose runs out of road, below the point where Kubernetes earns its complexity. It is positioning, not a benchmark result, and we do not present it as one. A platform total is that per-node figure across however many nodes a control plane manages — an architectural consequence, not something we have measured at fleet scale, so we publish no fleet number either. The Kubernetes figure is that project’s own documented ceiling for a supported cluster: “No more than 110 pods per node”, stated alongside “No more than 5,000 nodes” and “No more than 300,000 total containers” — kubernetes.io. The two columns do not count the same unit — Kubernetes limits pods, a pod holds one or more containers, and we count containers — so read them as adjacent rather than interchangeable. We do not convert between them, because the ratio depends on how the pods are built. Managed distributions cap lower again: AWS EKS derives the per-node pod cap from the machine’s network interfaces rather than from that documented figure, and its own worked example is 29 pods on a two-vCPU machine — the document cited in note 3. Nomad publishes no per-node ceiling at all, which is why its cell says so rather than carrying a figure. The largest run HashiCorp publishes is its own demonstration: 2,000,000 containers across 6,100 clients — Nomad’s word for a node running its agent — in 10 AWS regions, scheduled in 22 minutes by three servers — hashicorp.com — an average of about 330 containers per client. That is a demonstration rather than a supported limit, and it is a larger number than anything we have run.
-
The Nomad column is sourced, and it wins several rows. Nomad is the
nearest peer to Odysseus in this table — a single binary, light on resources, and built to
integrate with the same Consul this platform runs on — so a framing that works against Kubernetes
would be unfair here, and we have not used one.
Rolling updates, canaries with
auto_promote, automatic revert of a failed deployment and reverting to the last stable job are all in the job specification’supdateblock in the Community Edition — developer.hashicorp.com. Autoscaling is real, and arrives as a second daemon to run: the Nomad Autoscaler is “built and released separately to Nomad”, covers horizontal application and cluster scaling, and reads Prometheus among its metrics sources — developer.hashicorp.com. Secret handling is at least our equal: a task’ssecrets/directory is backed by an in-memory filesystem and mountednoexec— developer.hashicorp.com. ACL policies and roles are Community Edition. What is not: audit logging, resource quotas and Sentinel policy are Nomad Enterprise, as is deploying one job across federated regions — federating the regions themselves is not — developer.hashicorp.com. Namespaces are Community Edition, and they segment jobs, allocations, deployments and evaluations; the documentation is explicit that “Nomad does not namespace objects that are shared across multiple namespaces. This includes nodes” — developer.hashicorp.com. Kubernetes draws the same line — “low-level resources, such as Nodes … are not in any namespace” — kubernetes.io; on this platform a node is enrolled to a tenant, which is what that row records. The server figure is HashiCorp’s own reference architecture — “A Nomad cluster typically comprises three or five servers”, at 2–4 cores and 8–16 GB of memory each for a small production deployment — developer.hashicorp.com. That is machine sizing a reader should treat the way we treat the Kubernetes figure in note 2: a recommendation, not measured process memory. We found no published figure for the client agent, so the column says there is none rather than guessing at one, and the row on learning curve is our estimate rather than anyone’s measurement. -
The Athena tool count is a count of call sites, not a round number.
It is
server.registerTool(call sites inathena-mcp/src/tools/*.ts— 80 as of this writing — with two corrections applied on top: thecronjob_suspend/cronjob_resumepair is registered from a single call site inside a loop (one site, two tools, so +1), and the three discovery helpers (search_tools,describe_tool,request_tool) are registered separately bymakeDiscoveryTools()inserver.tsrather than by a call matching that pattern (+3). 80 − 1 + 2 + 3 = 84. Anyone can reproduce the base figure withgrep -rc "server.registerTool(" athena-mcp/src/tools/*.tsagainst the tagged release and re-derive the same total from the two corrections above.
Simple, transparent pricing
Base fee + per-node pricing that scales with you. Start free, upgrade as you grow.
For indie developers, home labs, and evaluation use.
- Up to 3 nodes
- 1 user
- Full Docker Compose compatibility
- WireGuard VPN mesh
- Basic Prometheus metrics
- 2-tier RBAC
- Community support
- No Athena AI
- No CVE scanning
For solo developers and tiny teams running small production workloads.
- Up to 5 nodes
- Up to 3 users
- Athena AI (100 queries/mo)
- Weekly CVE scanning
- Canary deployments
- Vault secret injection
- Basic SRE automation
- 30-day audit trail
- Email support (48h SLA)
For SMB production workloads. The core commercial tier.
- Up to 50 nodes
- Unlimited users
- Unlimited Athena AI
- Continuous CVE scanning + policy gating
- Full canary auto-promote/rollback
- Prometheus autoscaling
- Full SRE automation (8 incident types)
- Full 4-tier RBAC
- 90-day audit trail
- Priority support (4h SLA)
For multi-site organizations with compliance and custom SLA needs.
- Unlimited nodes
- Everything in Pro
- Multi-cloud, multi-region operation from a single control plane — see the proof
- SSO / SAML / LDAP / OIDC
- One-year audit trail
- SOC 2- and ITSG-33-aligned controls and audit evidence — detail
- Volume discounts (50+ nodes)
- Dedicated account manager
- 1h SLA + 24/7 on-call support
Hosting providers, MSPs and agencies run many customers on one control plane, with tenancy as a real boundary. Pricing for that is a conversation, not a card.
Delta Telematics is a Canadian company, and this site is published in English, French and Simplified Chinese. Your nodes are yours: workloads, volumes and the data in them sit on servers you control, in your own jurisdiction, while the control plane holds orchestration state rather than your application's data. Personal information is handled under PIPEDA. Geographic placement enforcement — pinning a workload to a country or region within your own fleet — is available and switched off by default.
Start orchestrating
in under 10 minutes.
Sign up, connect your first node, and deploy — all in under 10 minutes. No Kubernetes expertise, no dedicated platform team.